Are small caps signaling a shift in leadership?

S&P 500 vs. Russell 2000 – Time for small caps?
When you chart the S&P 500 against the Russell 2000, you see a potential story. Large caps have dominated for nearly a decade. Small caps had a brief moment in 2021, but since then, the S&P has kept the upper hand.
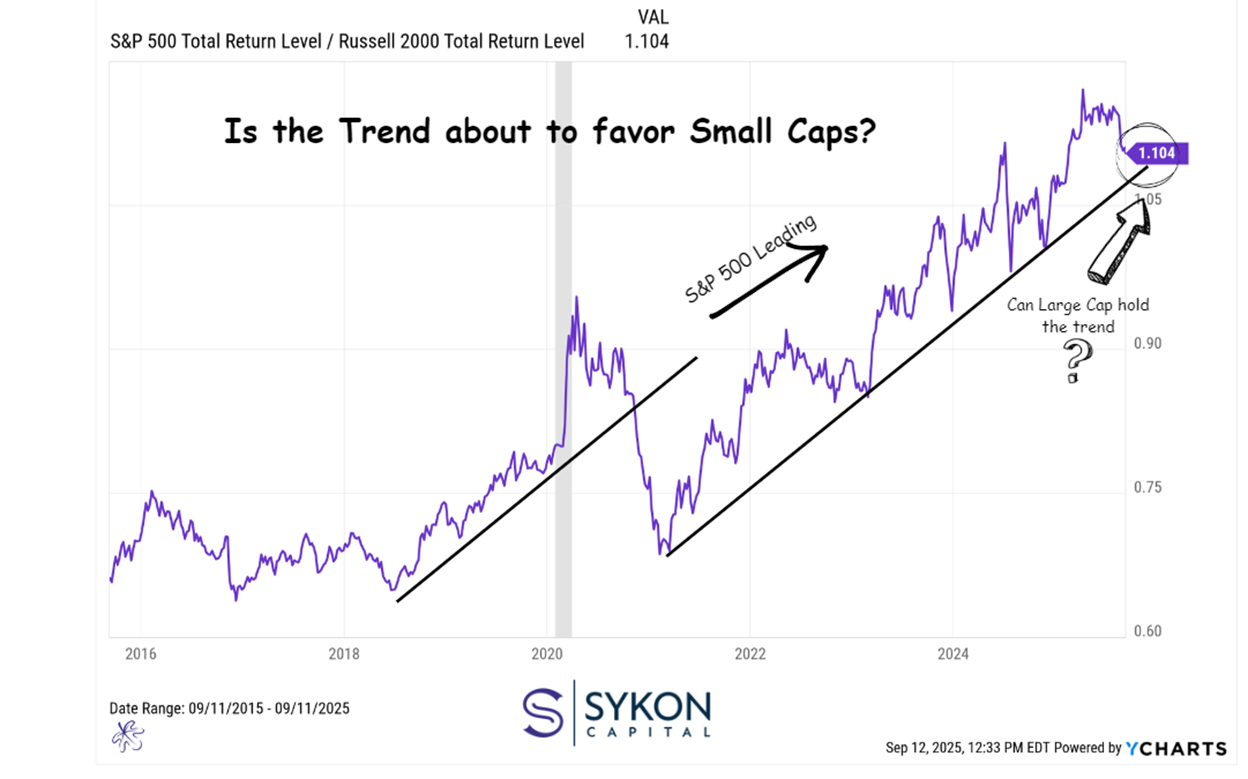
Now, that ratio is pressing on a key support line. If small caps start to outperform and push the ratio lower, it could signal a real shift in leadership. For portfolios, that could mean diversifying away from the mega-cap names that have driven so much of the market’s returns.
The risk in staying concentrated is simple: leadership rotates. The companies that have worked so well in recent years may not always be the ones that lead. Small caps, with their growth potential and sensitivity to the U.S. economy, could be the next place where returns show up.
This isn’t about abandoning large caps, it’s about balance. If that support line breaks, it may be the market telling us it’s time to give small caps another look.
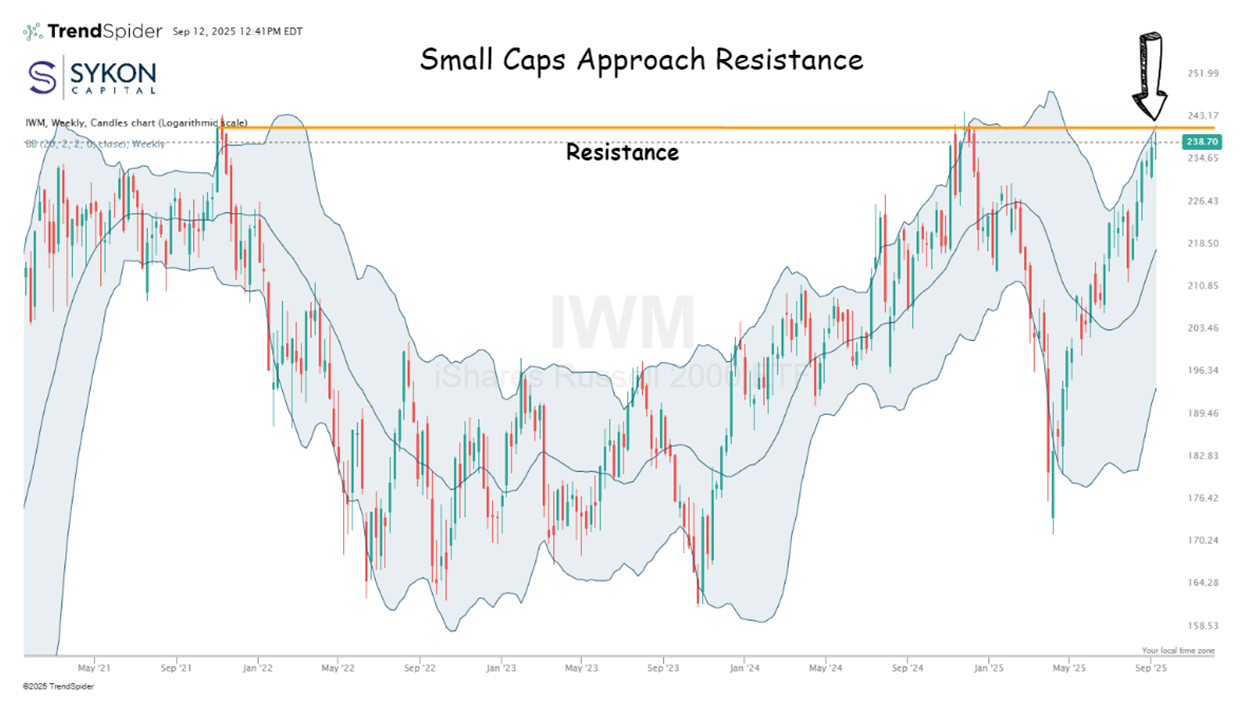
Russell 2000 at a crossroads
The Russell 2000 is once again testing overhead resistance that dates back to the COVID era. While the S&P 500 has gone on to make new highs, small caps have repeatedly failed at this same level, first in 2021, then again in late 2024.
We’re right back there now. If the Russell can break through, it would confirm that small caps are starting to close the long-standing gap against large caps. That kind of breakout could bring new momentum into the space and reward portfolios that have some exposure to smaller companies.
I believe that there are deregulatory tail winds that can potentially be the catalyst that helps small caps break out in this cycle compared to the previous cycles.
But if it fails again, it reinforces the same pattern we’ve seen for years, large caps leading, small caps lagging. That’s why this moment matters.
It’s less about predicting the outcome and more about staying alert. Markets move in cycles. If small caps get going, the leadership baton could finally start to pass.
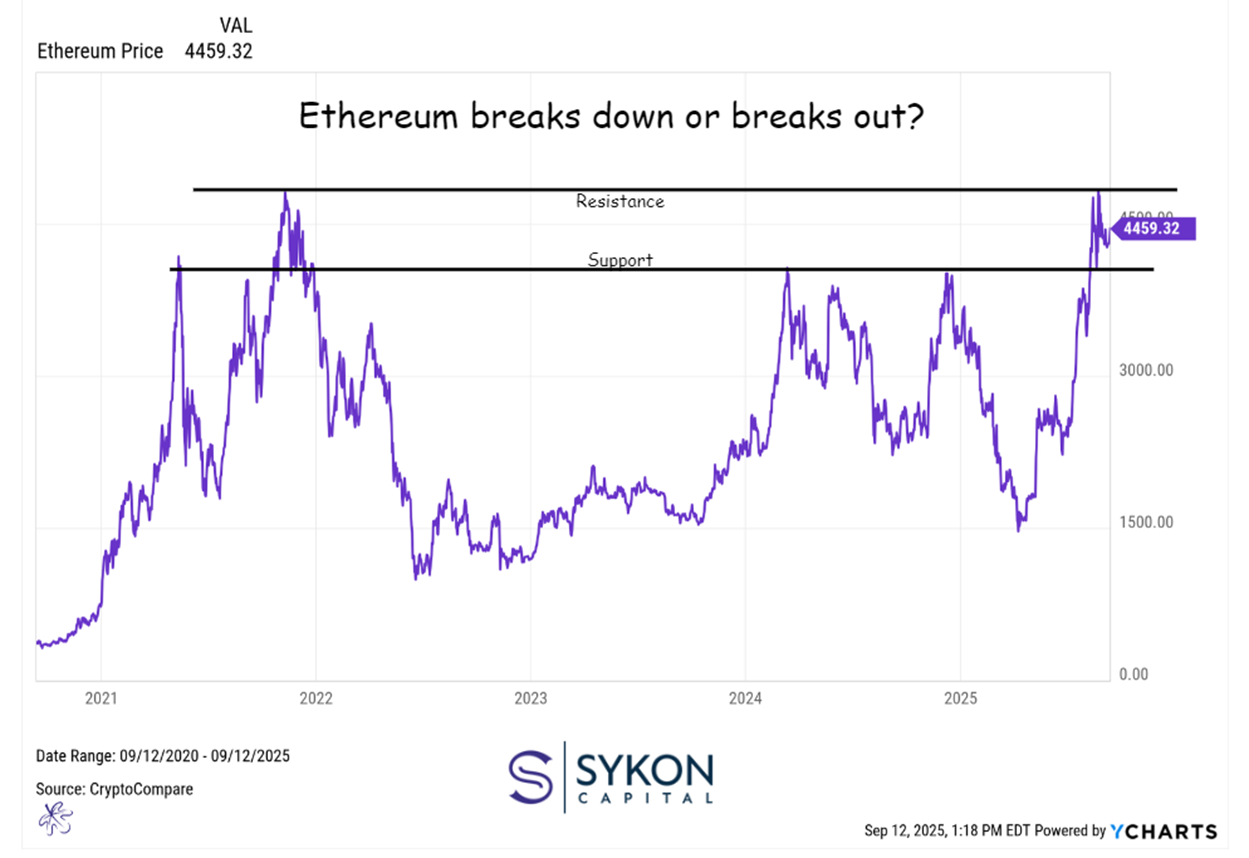
Ethereum and the risk signal
Bitcoin may get most of the attention, but Ethereum deserves a look right now. After a strong rally, it’s back at resistance we last saw in 2021. At the same time, support isn’t far below. That leaves Ethereum stuck in a tight range, and given how crypto trades, it probably won’t stay there long.
A breakout above resistance could open the door to new highs. A breakdown could send it back to 3,000 or even 1,500.
Why does this matter for equity investors? Because crypto often serves as a proxy for risk appetite. If Ethereum breaks higher, it suggests investors are willing to take on more risk, something that could spill over into small caps. If it breaks lower, it points to a more cautious tone, potentially keeping leadership with the large, established names.
Ethereum won’t decide where stocks go, but it’s one more piece of the puzzle. Watching crypto alongside the S&P 500 and Russell 2000 gives us a better sense of where the next leg of market leadership may come from.
Unlock exclusive gold and silver trading signals and updates that most investors don’t see. Join our free newsletter now!
Unlock exclusive gold and silver trading signals and updates that most investors don’t see. Join our free newsletter now!
Author

CMT Association Research Team
CMT Association
The CMT Association is a global credentialing body that has served the financial industry for nearly 50 years.


