Apple Inc. (AAPL) Elliott Wave technical analysis [Video]
![Apple Inc. (AAPL) Elliott Wave technical analysis [Video]](https://editorial.fxstreet.com/images/Markets/Equities/Industries/CommunicationServices/mobile-phone-637435389695511071_XtraLarge.jpg)
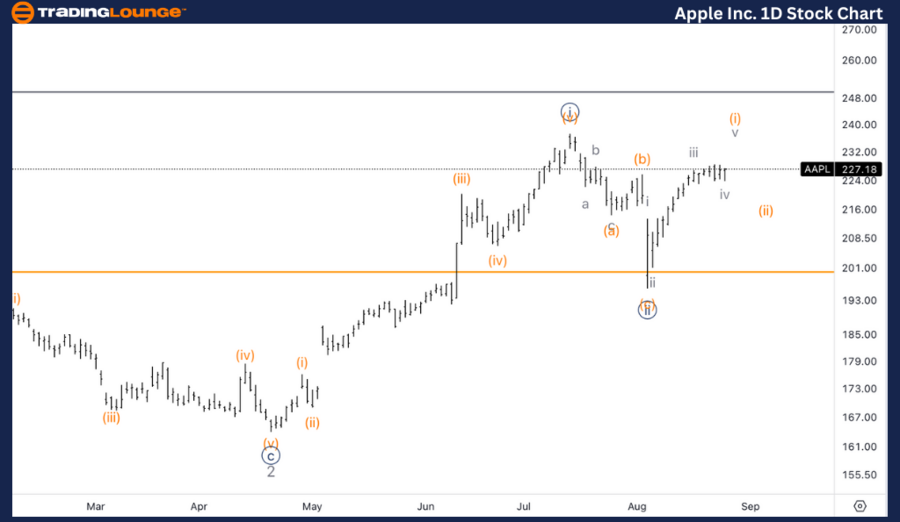
AAPL Elliott Wave technical analysis
Function: Trend.
Mode: Impulsive.
Structure: Motive.
Position: Wave {iii} of 3.
Direction: Upside in wave {iii}.
Details: Aggressive count to the upside with a double 1-2. As long as we keep trading above 200$ we can foresee further long term upside.
AAPL Elliott Wave technical analysis – Daily chart
AAPL is currently in wave {iii} of 3, following an aggressive count that suggests a double 1-2 formation. As long as AAPL remains above the $200 level, further long-term upside is anticipated. This bullish scenario suggests that AAPL is poised to continue its upward trajectory, driven by strong momentum within wave {iii}.
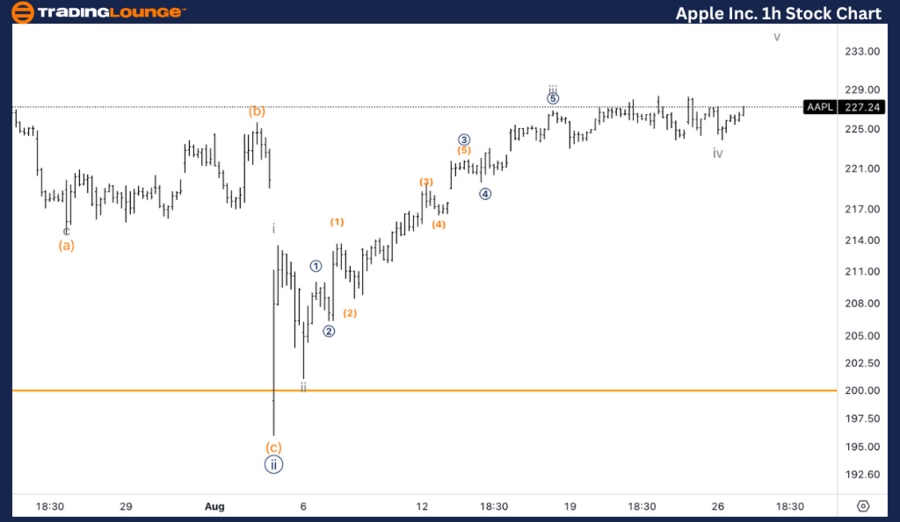
AAPL Elliott Wave technical analysis
Function: Trend.
Mode: Impulsive.
Structure: Motive.
Position: Wave (i) of {iii}.
Direction: Top in wave (i).
Details: Looking for one more leg higher towards 230$, the top of MinorGroup1, to then correct within wave (ii) of {iii}.
AAPL Elliott Wave technical analysis – One-hour chart
The 1-hour chart suggests that AAPL is nearing the completion of wave (i) within the larger wave {iii}. We anticipate one more leg higher towards the $230 level, which aligns with the top of MinorGroup1. Following this, a corrective phase within wave (ii) of {iii} is expected. This correction could present a buying opportunity before the next leg higher.
Welcome to our latest Elliott Wave analysis for Apple Inc. (AAPL). This report provides a detailed overview of AAPL's price movements using Elliott Wave Theory, aiming to help traders identify potential opportunities based on the current wave structure. We will analyze both the daily and 1-hour charts to offer a comprehensive understanding of AAPL's market behavior.
Apple Inc. (AAPL) Elliott Wave technical analysis [Video]
Author

Peter Mathers
TradingLounge
Peter Mathers started actively trading in 1982. He began his career at Hoei and Shoin, a Japanese futures trading company.


