Apple breaks lower as chip costs pressure the AI trade
Summary
- Apple is trading near $274 after a sharp 4H breakdown below the $287.22 change-of-character level.
- The catalyst is not weak AI demand, but the cost of AI: rising memory and storage chip prices are forcing Apple to raise prices on MacBooks and iPads.
- Apple’s long-term fundamentals remain strong, supported by Services, iPhone demand, and buybacks, but the market is now questioning hardware margins and demand elasticity.
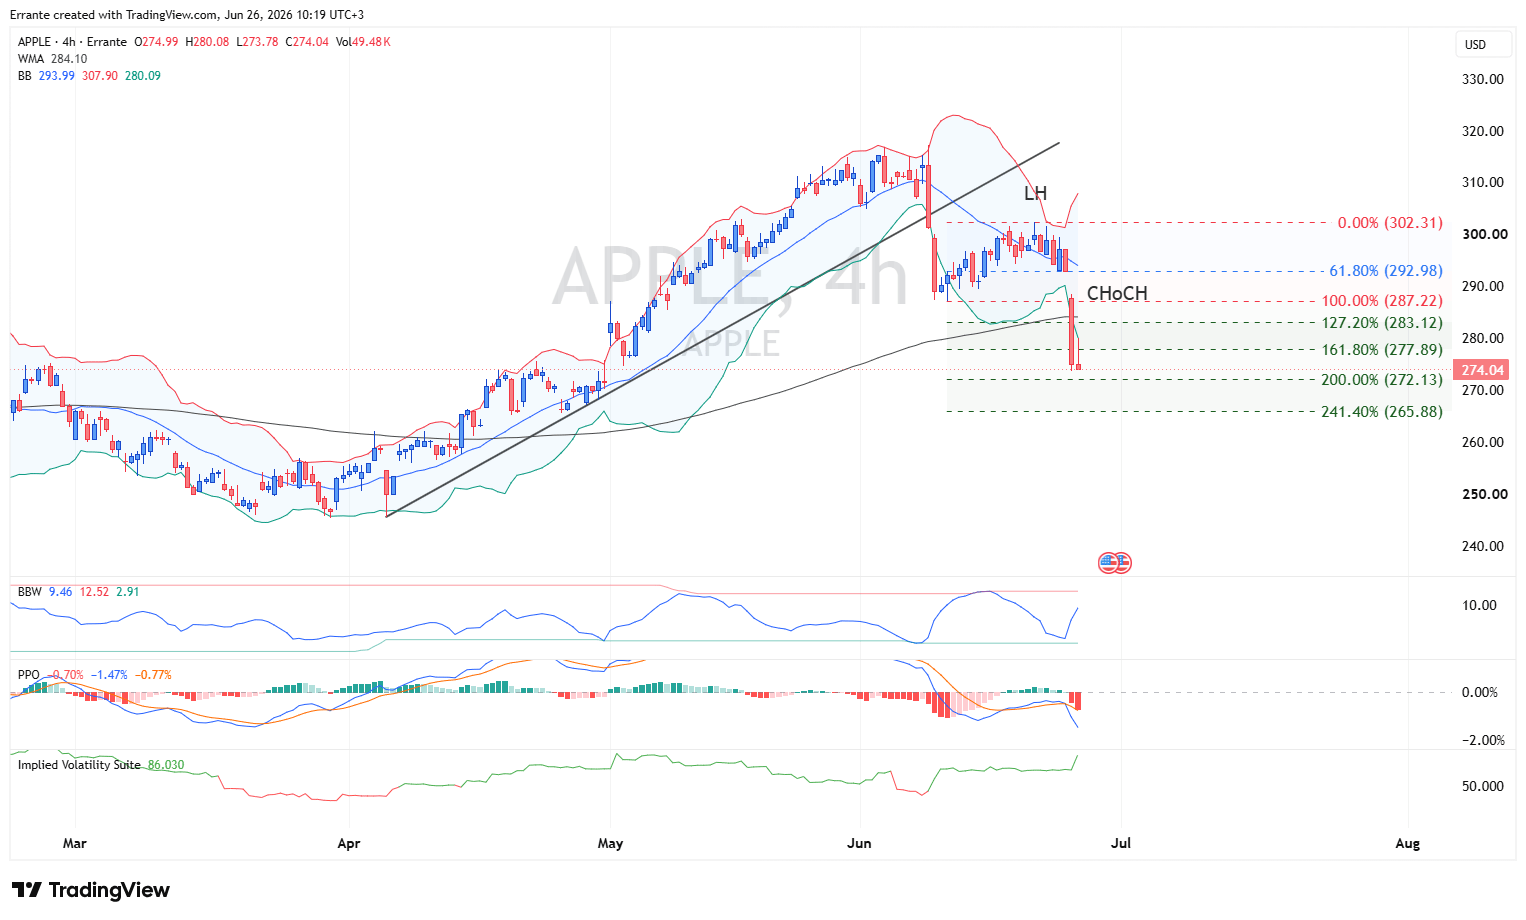
- The chart has turned bearish below $287.22 and $283.12, with $272.13 and $265.88 as the next downside levels.
Market overview
Apple enters June 26 under clear pressure as investors reassess the downside of the AI supply chain. The stock has fallen sharply after Apple raised prices on selected MacBooks and iPads to offset surging memory and storage chip costs. This is important because the market has been treating AI as a broad bullish theme for technology. Apple’s move shows the other side of that trade: AI infrastructure demand is pushing component costs higher, and device makers may not be able to absorb those costs without passing them to consumers.
The transmission channel is direct. AI data-center investment increases demand for memory and storage chips. Chip prices rise. Hardware producers face margin pressure. If they raise prices, demand may weaken. If they do not raise prices, margins compress. Either outcome challenges the premium valuation investors have assigned to Apple.
This is why the selloff matters beyond one trading day. Apple is not a pure AI infrastructure winner like some semiconductor names. It is a consumer-device company with an ecosystem advantage. If AI raises input costs faster than Apple can monetize AI features through devices and Services, the market may begin to discount a lower hardware-margin profile.
That said, the fundamental story is not broken. Apple’s latest quarter showed revenue of $111.2 billion, up 17% year over year, while EPS rose 22% to $2.01. Services reached a new all-time high, and the company continues to return capital through dividends and buybacks. These are strong structural supports. But the market is now asking a different question: are Services and buybacks enough to offset rising hardware-cost pressure?
Fundamental outlook
The next phase depends on whether investors view the price hikes as a margin-protection strategy or a demand-risk signal. If Apple can pass higher component costs to consumers without damaging unit demand, the stock may stabilize. If the market sees price increases as a sign that AI-driven chip inflation is starting to hurt consumer hardware demand, valuation pressure can continue.
Services remain the key stabilizer. High-margin recurring revenue gives Apple a stronger cushion than most hardware peers. However, Services alone may not fully offset investor concerns if MacBook and iPad demand slows or if memory costs continue to rise.
The broader market signal is also important. Apple’s selloff has dented confidence in the idea that all large technology companies benefit equally from AI. The new distinction is sharper: chip suppliers benefit from scarcity pricing, while device makers face input-cost inflation.
Technical analysis
The 4H chart shows a decisive bearish regime shift. Apple had been in a strong uptrend through May, but price broke the rising trendline in June, formed a lower high near the $302.31 area, and then failed to hold the $287.22 change-of-character level.
The breakdown below $287.22 is the key technical signal. This level marks the 100% Fibonacci reference and the point where the prior structure shifted from consolidation into downside expansion. Price is now trading near $274.04, below the 161.8% extension at $277.89 and close to the 200% extension at $272.13.
The moving-average setup confirms the bearish turn. Price is below the WMA near $284.10, which now acts as dynamic resistance. The lower Bollinger Band near $280.09 has also been broken, showing that selling pressure has moved beyond normal range behavior.
Momentum is bearish. PPO is deeply negative, and the histogram remains below zero, confirming downside acceleration. Bollinger Band Width is elevated, showing volatility expansion after the breakdown. Implied volatility has also risen sharply near 86, indicating that traders are paying more for protection as the stock reprices lower.
Key levels
- Immediate resistance: $277.89.
- Main reclaim zone: $283.12-$287.22.
- Higher resistance: $292.98 and $302.31.
- Immediate support: $272.13.
- Deeper support: $265.88.
- Invalidation level for the bearish setup: sustained 4H close above $287.22.
Scenario map
Main scenario
Apple remains bearish while price trades below $287.22. A sustained move below $272.13 would expose $265.88, especially if investors continue to price margin pressure and weaker hardware demand.
Alternative scenario
If buyers defend $272.13 and price reclaims $277.89, Apple may attempt a corrective bounce. A stronger repair signal requires a 4H close back above $283.12 and then $287.22. The bearish short-term thesis is invalidated by a sustained 4H close above $287.22. That would place price back above the change-of-character zone and suggest the breakdown has failed.
Conclusion
Apple remains a high-quality company, but the stock is now facing a different market narrative. AI is no longer only a growth catalyst; it is also a cost shock for consumer hardware. Below $287.22, sellers control the 4H structure. Below $272.13, downside risk extends toward $265.88.
Author

Ali Mortazavi
Errante
BEc, CMSA, Member of IFTA - International Federation of Technical Analysis, Associate Member of STA - Society of Technical Analysis (UK).

















