Apple Stock Price and Forecast: Why was AAPL stock up on Wednesday?
- AAPL stock one of the few big tech names in the green on Wednesday.
- Apple pushed up but failed to break $144.50.
- The tech-giant stock is still in a downtrend but may have put in a double bottom.
Apple stock (AAPL) was green on Wednesday despite most big-tech names closing lower even as most equity indices recovered in the second half of the day. Whether this was a dead-cat bounce or some change in sentiment is not clear but the recent worries of rising yields, Evergrande, and US debt ceiling problems have not gone away.
Reports this morning from Reuters say Evergrande missed a second payment on offshore debt, and in the US, politicians continue to squabble over the debt ceiling. Democrats will likely have to go alone on this one. Ten-year yields in the US continue to rise, even if the pace of the rise appears to be slowing, but the dollar is certainly pricing in further gains as it hit a new 1.15 handle versus the euro.
All this makes markets nervous and we remain cautious on our outlook for Apple. Semiconductor issues are still hitting many tech firms and the US and EU agreed on Wednesday to try to work together by launching a US-EU Trade and Technology Council. Reuters does report, however, that the new group made a statement in relation to the growing influence of big tech, as they are "committed to transatlantic cooperation regarding platform policies that focus on disinformation, product safety, counterfeit products, and other harmful content."
-637685872922377559.png)
Apple 15-minute chart
Apple key statistics
| Market Cap | $2.3 trillion |
| Enterprise Value | $2.3 trillion |
| Price/Earnings (P/E) | 29 |
|
Price/Book | 38 |
| Price/Sales | 9 |
| Gross Margin | 41% |
| Net Margin | 25% |
| EBITDA | $112 billion |
| 52 week low | $103.10 |
| 52 week high | $157.26 |
| Average Wall Street rating and price target |
Buy $166.7 |
Apple stock forecast
The interesting thing to note from the daily chart below and the 15-minute chart above is how Apple stock closed quite a bit lower than the intraday high. This level also formed a double top and failed at the $144.50 mark. The daily candle created a long wick which is generally bearish and for the session, Apple (AAPL) stock traded between two key levels, $141.67 and $144.50. The stock is still below the 9-day moving average, the Moving Average Convergence Divergence (MACD) is still in bearish mode and the other momentum oscillators are trending lower.
FXStreet View: AAPL bearish, neutral above $144.50, bullish above $151.42
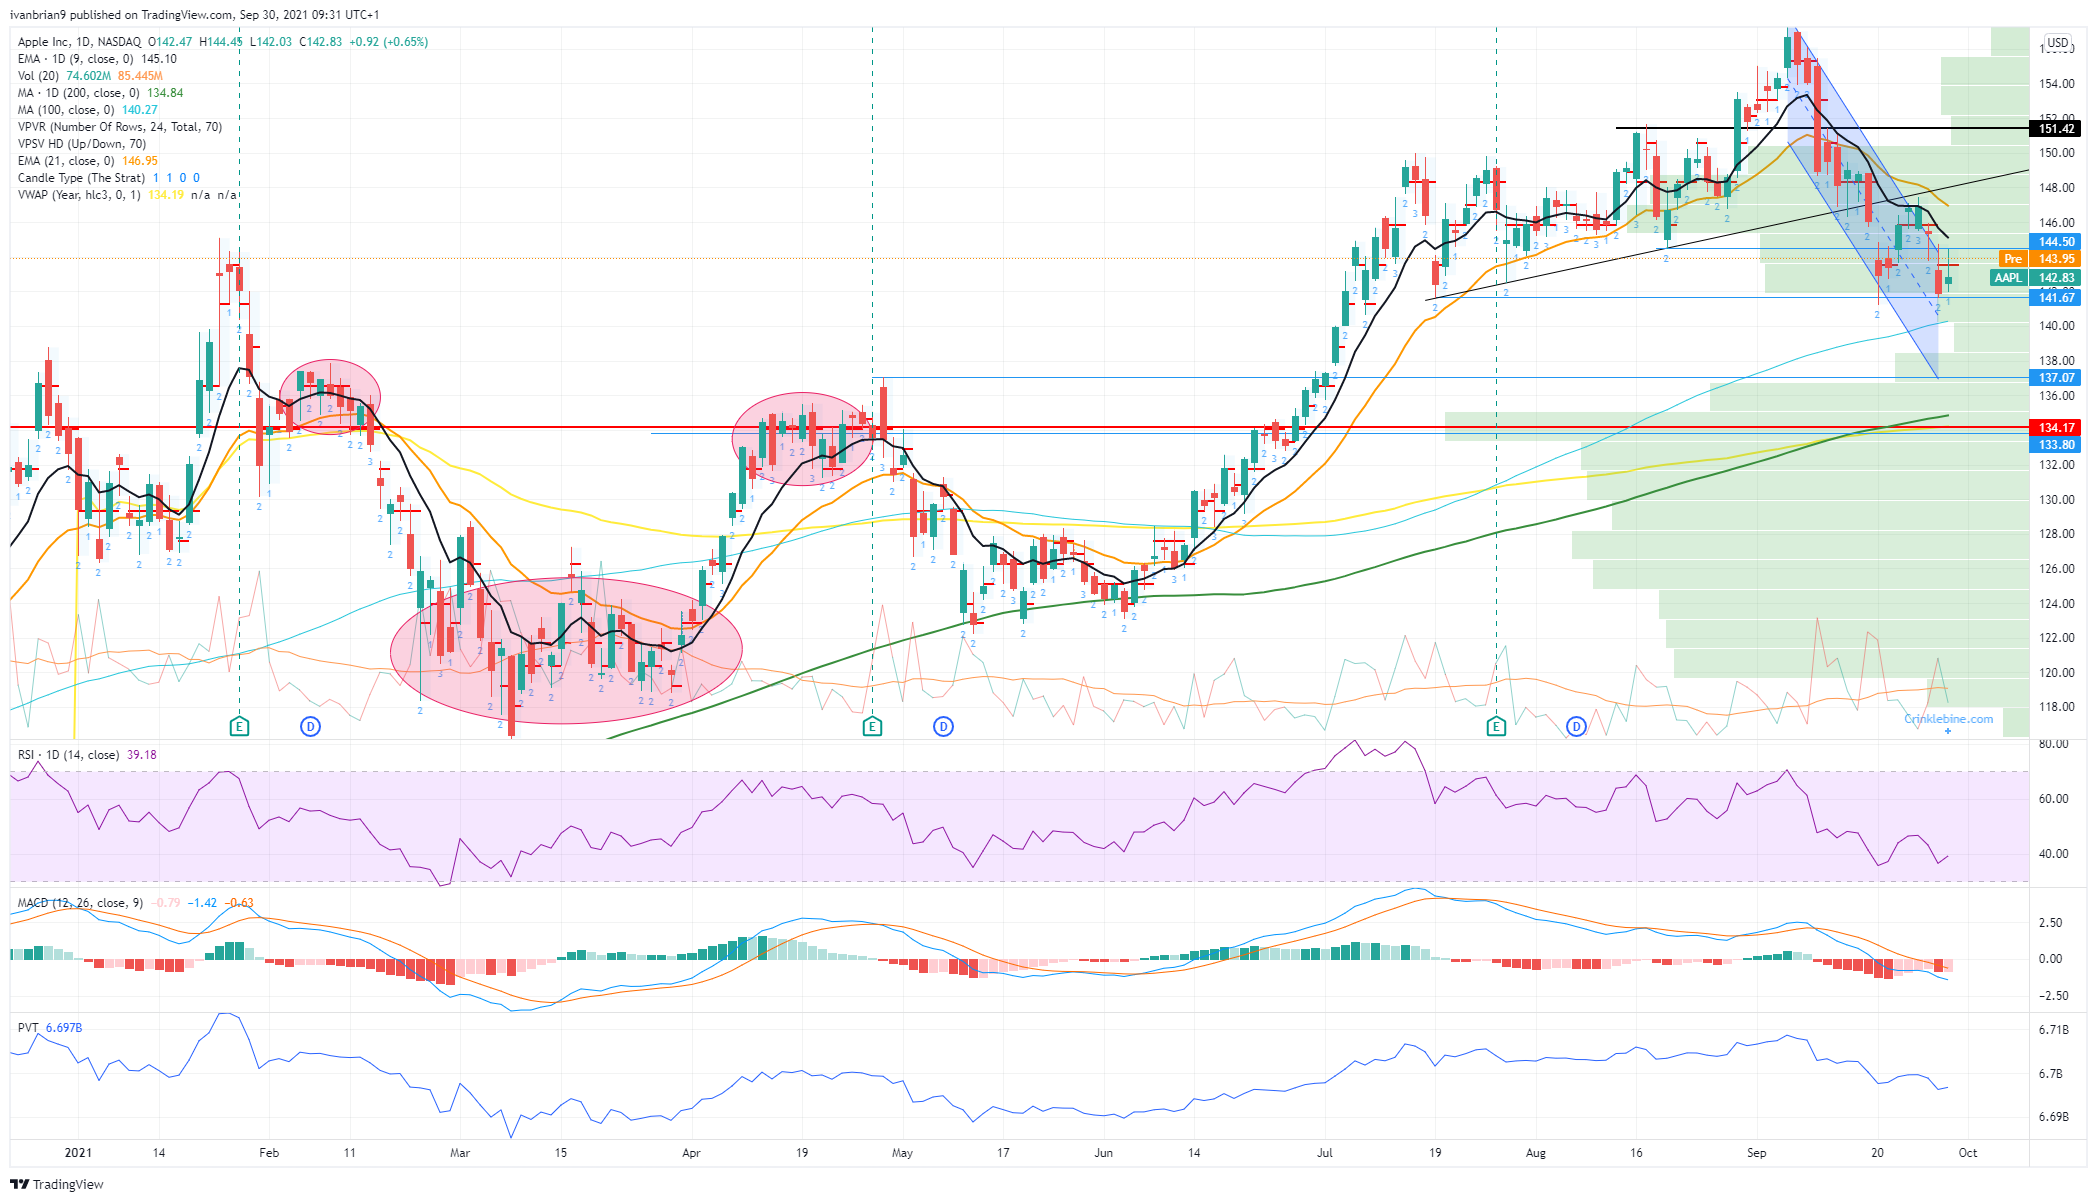
AAPL daily chart
Premium
You have reached your limit of 3 free articles for this month.
Start your subscription and get access to all our original articles.
Author

Ivan Brian
FXStreet
Ivan Brian started his career with AIB Bank in corporate finance and then worked for seven years at Baxter. He started as a macro analyst before becoming Head of Research and then CFO.


