AMC Entertainment Holdings forecast: AMC looks to break down to $30
- AMC shares lost over 5% on Tuesday as retail stocks suffer.
- AMC is still stuck in a tight triangle range.
- AMC stock needs to target a breakout to $30 or $50.

AMC stock is at least moving a bit more than of late, but the range is still tight despite a 5% loss on Tuesday. The triangle formation remains intact as we await signs of a breakout and a possible target. We can see that, like most stocks on Tuesday, the last hour saw a bit of a recovery. AMC was down over 7% at one point before gaining 2% in the last hour to close at $39.16. At the time of writing the AMC premarket quote is steady at $39.18. The stock is trending heavily on social media, but actual news flow seems to be lacking.
-637733513828174209.png)
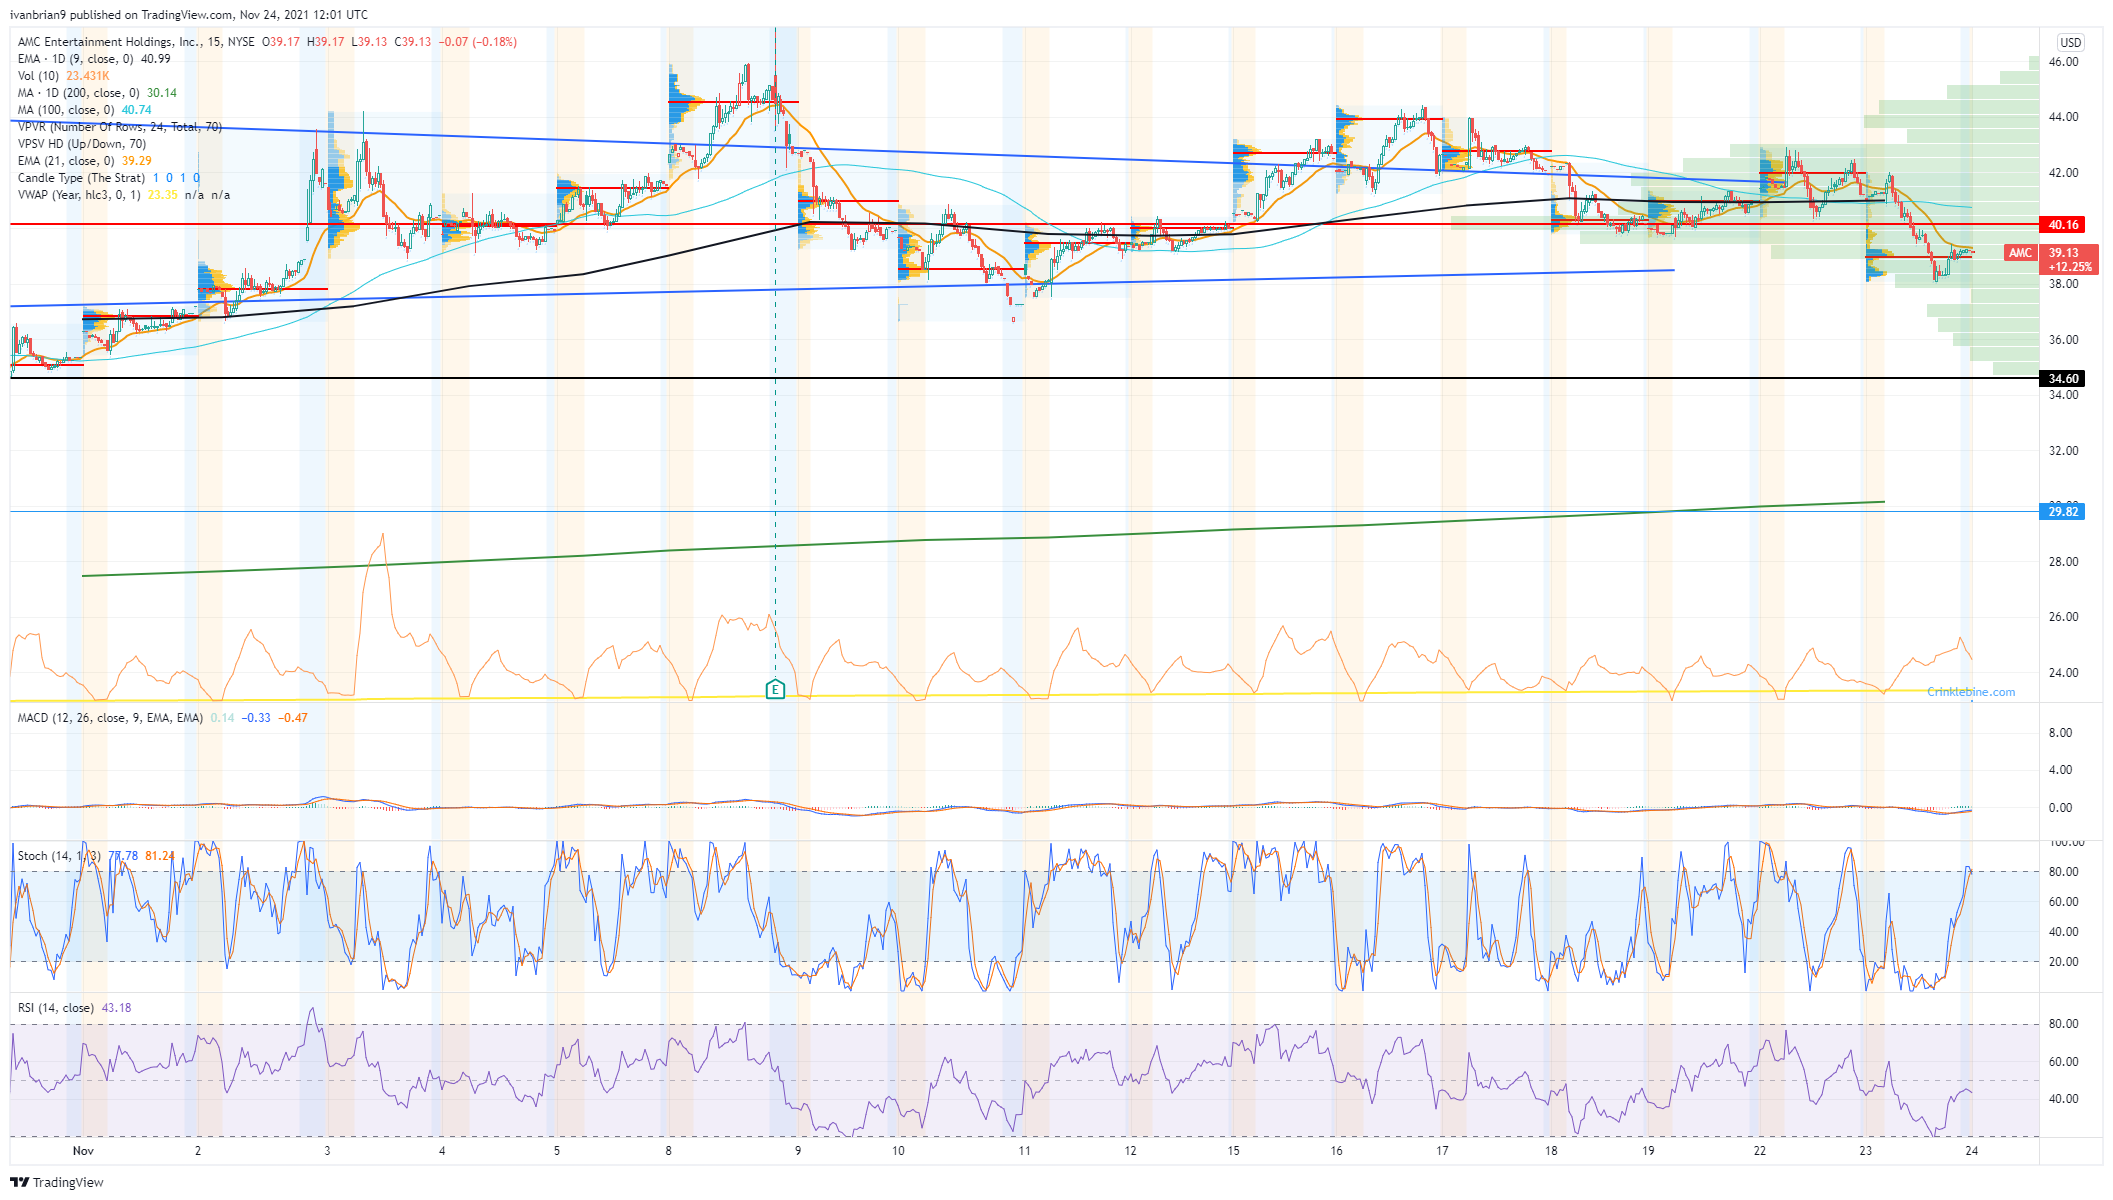
AMC chart, 30-minute
AMC stock news
Cineworld has joined the crypto cinema revolution as it follows AMC into accepting some forms of the more popular cryptocurrencies. We do wonder whether this smacks of modernization or desperation. For sure it gathers some attention, which is what momentum stocks need. Holiday season approaches, which is traditionally the cinema industry's key revenue quarter, so it will be interesting to see how AMC and Cineworld attendances go. Early indications are positive with Ghostbusters on point and Disney has holiday slates due in theatres. Disney has put a slight dampener on bullish attendance projections from the cinema industry as it shortens the time between releases hitting its streaming service Disney+ in order to combat slowing subscriber growth and battle Netflix (NFLX).
AMC stock forecast
The 15-minute chart below shows us the snooze fest AMC trading has become, with the range for November so far being a relatively sedate $5 to $6. This is not something retail or AMC apes are used to. $39 to $42 is an area of heavy volume that implies strong support.
The daily view is what makes this one potentially interesting with the triangle formation likely to see a breakout soon. That is the theory, but it may not happen this week with Thanksgiving and lower volumes. The key support evels remain $34.60 and $30 with resistance at $54.86. We can see from the volume line how it has totally dropped off and the MACD is similarly flatlining. Normally in a momentum stock when volume slows momentum falls and so does the price. But shorts have been well warned here, so it instead leads to a virtual shutdown with no movement.
$30 remains the stronger of the support levels as the 200-day moving average is down there and the yearly VWAP is close by.
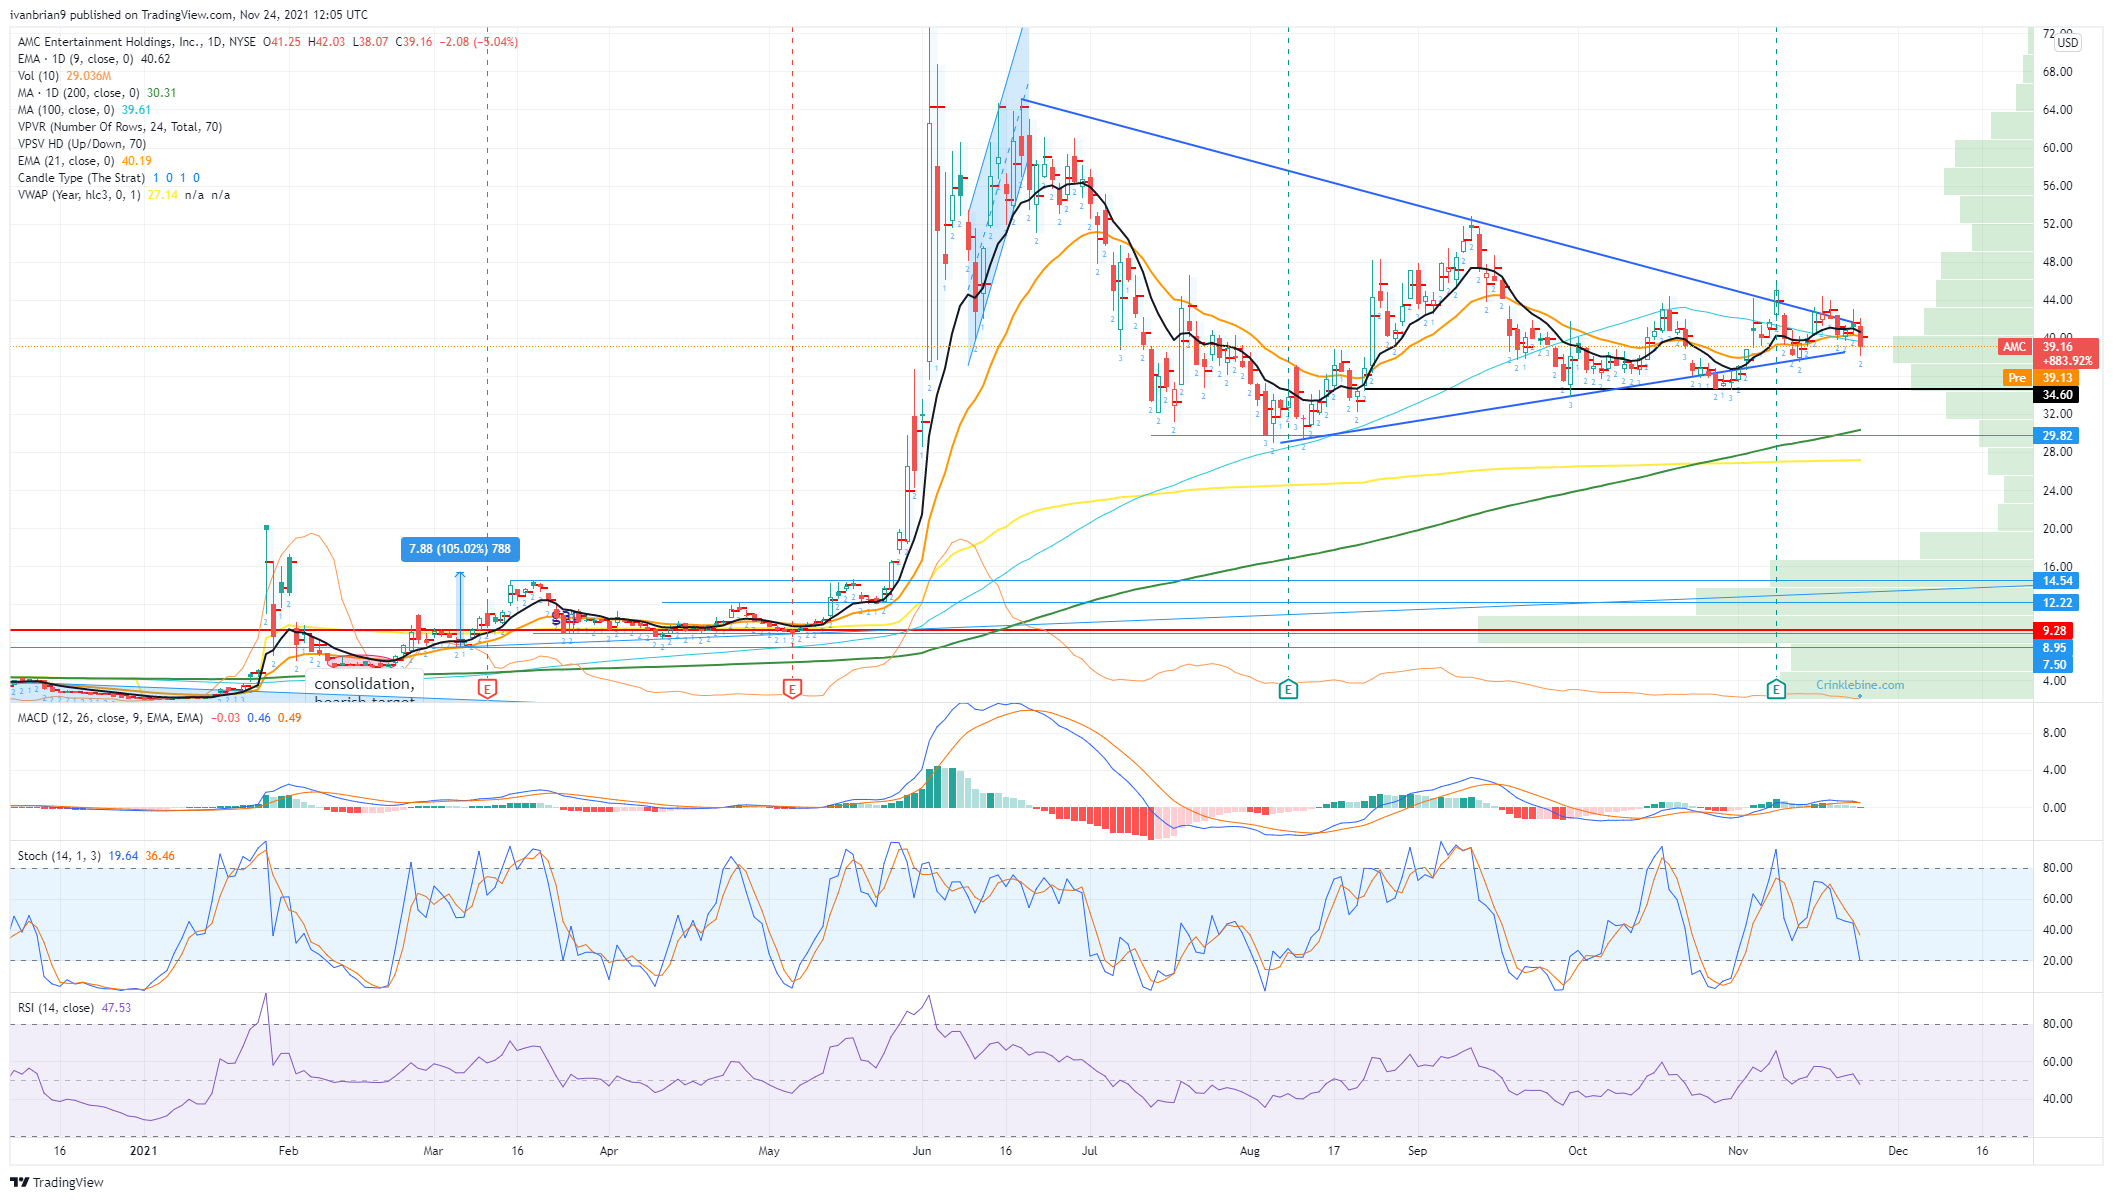
AMD 1-day chart
Premium
You have reached your limit of 3 free articles for this month.
Start your subscription and get access to all our original articles.
Author

Ivan Brian
FXStreet
Ivan Brian started his career with AIB Bank in corporate finance and then worked for seven years at Baxter. He started as a macro analyst before becoming Head of Research and then CFO.


