|

Alphabet Inc. $GOOGL soars 40% from blue box area, with $340 target still ahead

In today’s article, we’ll examine the recent performance of Alphabet Inc. ($GOOGL) through the lens of Elliott Wave Theory. We’ll review how the powerful rally from the October 2025 low unfolded as a textbook 5-wave impulse and discuss our evolving forecast for the next move. Let’s dive into the fascinating structure and expectations for this tech giant.

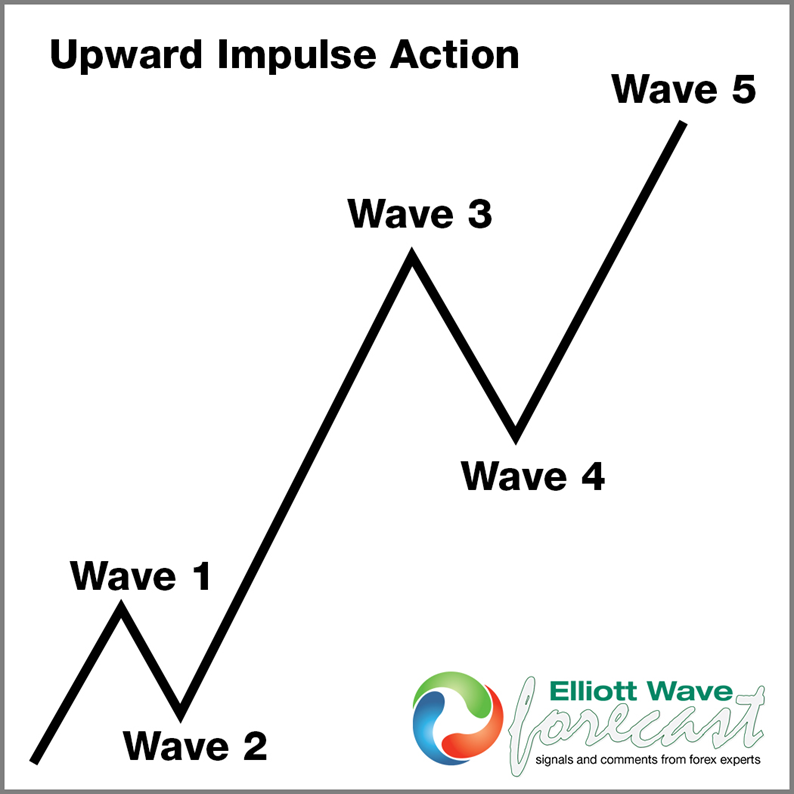
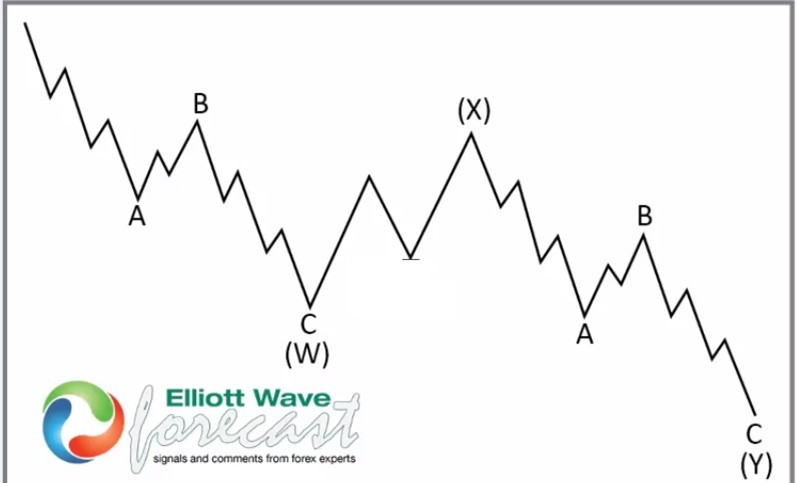
Five wave impulse + seven swing WXY correction

Chart
Chart

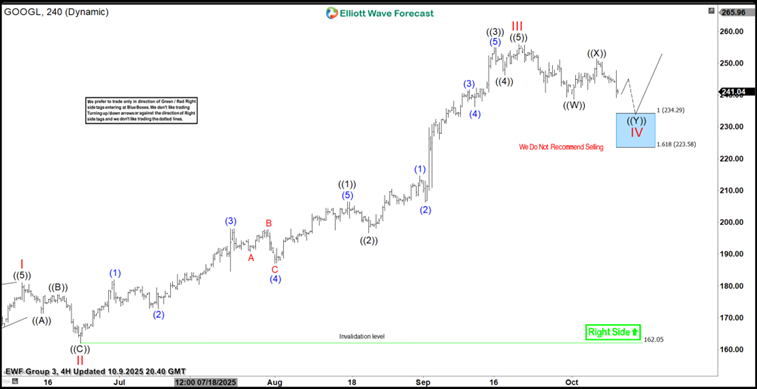
$GOOGL 4H Elliott Wave chart 10.09.2025

Chart

$GOOGL 4H Elliott Wave chart 11.24.2025

Chart

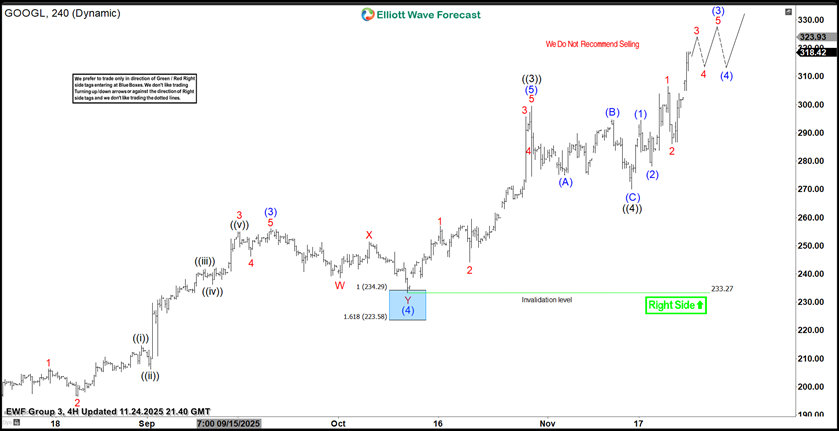
to our latest update, and the charts tell a compelling story. $GOOGL bounced right from that “blue box.” This wasn’t a small bounce. It was a huge rally, up about 40%! The stock hit new all-time highs.

Right now, the stock is still climbing. It is in what we call wave (3) of wave ((5)). This means more gains are likely. We think $GOOGL could reach $340–$347 next. After that, we might see another pullback.

Conclusion

In conclusion, our Elliott Wave analysis of $GOOGL continues to prove accurate, suggesting that the stock remains well-supported against its April 2025 lows. For traders who capitalized on the entry opportunities presented in the “blue box” area, the $340–$347 zone should be closely monitored as the next significant objective. In the interim, keeping a vigilant eye out for any healthy corrective pullbacks could present fresh entry opportunities for those looking to join the trend.

By applying the principles of Elliott Wave Theory, traders can gain a deeper understanding of market cycles, better anticipate the structure of upcoming moves, and ultimately enhance their risk management strategies in dynamic markets like the current one for $GOOGL.

Author

Elliott Wave Forecast Team

Elliott Wave Forecast Team

ElliottWave-Forecast.com

More from Elliott Wave Forecast Team
Share:

Editor's Picks

GBP/USD resumes downside below 1.3200

GBP/USD resumes its downside below 1.3200 in European trading on Wednesday. The pair remains vulnerable amid a broadly firmer US Dollar and chaotic UK political environment. The focus is now on BoE-speak for further trading impetus.

EUR/USD sits at yearly low near 1.1350 on USD strength

EUR/USD sits at yearly lows near 1.1350 in the European morning on Wednesday. The pair remains vulnerable to further declines amid a bullish US Dollar. The Greenback continues to draw support from hawkish Fed bets and US-Iran peace deal uncertainty.

Gold: Bears retain control as Fed rate hike bets continue to boost USD

Gold recovers slightly from a nearly two-week low, around the $4,050 region, touched earlier this Wednesday. The commodity, however, sticks to its bearish bias for the second straight day, and seems vulnerable to weaken further amid sustained US Dollar buying.

Dogecoin tests a key make-or-break point amid waning retail support

Dogecoin trades below $0.08000 maintaining a steady decline for the seventh straight week. The meme coin is losing its retail strength as DOGE futures Open Interest drops 10% in 24 hours, while institutional demand remains muted with zero inflows so far this week.

Tech rout weighs on US stocks as the USD clocks a fresh 2026 high

Major US equity benchmarks ended Tuesday’s session considerably in the red, with the Nasdaq 100 down 3.3%, the S&P 500 off by 1.4%, and the Dow Jones down 0.1%. Stocks were largely weighed down by tech amid doubts over the AI-driven rally; the Philadelphia Semiconductor Index slid nearly 8%.

Regime change: Inside Kevin Warsh's first move to make the Fed unreadable on purpose

The rate did not move. That was the least interesting thing about Kevin Warsh's first meeting in charge of the Fed. The FOMC held its benchmark at 3.50%-3.75% for the fourth straight meeting, exactly as priced, and then the new chair used his first press conference to dismantle the machinery the market has leaned on for a decade.