Alibaba Stock Forecast: BABA shares in turnaround mode after Singles Day record
- 290,000 brands took part in Alibaba's Singles Day.
- Alibaba's 13th Singles Day brought in a record $84.7 billion.
- BABA stock kicker formation forecasts bullish reversal.

Despite much hoopla about regulatory woes and government obstinance, and the repeated certainty by critics that this year the event would be "muted," Alibaba (BABA) shares jumped on both Wednesday and Thursday on positive news regarding the e-commerce giant's Singles Day. At the time of writing, BABA shares are down 1.8% at $164.88 at the start of Friday's session.
Alibaba Stock News: Singles Day sales up 14%
Alibaba's Singles Day – the largest shopping day event of its kind in the world – brought in $84.7 billion in gross merchandise sales. This was 14% higher than last year, a time when BABA stock first began to slide after Chinese regulators put a halt to the IPO of ANT Financial, a one-time subsidiary.
This was the 13th year of the event. Though many critics focused on the sales growth slide of the event, the figures appear impressive since China is facing both a supply chain slowdown and a fall in consumer spending.
Last week, Alibaba Cloud unveiled both new custom proprietary servers for use at its data centers and in-house designed Yitian 710 server chips, as well as announcing the construction of two new data centers in Thailand and South Korea.
With less than one week before the next earnings results, Wall Street consensus has Alibaba reporting earnings per share (EPS) of $1.95 – 28% lower than the year prior – on revenue of just over $32 billion. That last figure should warm the hearts of some investors as it is a 36% gain YoY from the $23.5 billion in revenue reported in the same quarter last year.
BABA key statistics
| Market Cap | $453 billion |
| Price/Earnings | 18.9 |
| Price/Sales | 3.6 |
| Price/Book | 2.8 |
| Enterprise Value | $393.6 billion |
| Operating Margin | 13.7% |
| Profit Margin |
19.3% |
| 52-week high | $319.32 |
| 52-week low | $138.43 |
| Short Interest | 2.7% |
| Average Wall Street Rating and Price Target | Buy 243.18 |
BABA Stock Technical Analysis: A kicker to boot
Alibaba stock had been trending down since the end of October in what seemed like a prolonged correction. BABA appears to have found its legs, however, on Wednesday, when the stock decided to go against the grain and open well above Tuesday's close. Thursday again showed another kicker candlestick that opened above the high on Wednesday. This is significant since Wednesday saw a long wick on top pushed down by bears.
Typically, a kicker pattern like this is the sign of a reversal. If last Friday's low in the $158s is truly the bottom, then bulls need to confirm this by pushing to a new high above the October 20 high of $182.32. If BABA stock can surmount that prior swing high, then this will confirm that the stock is traversing a new ascending price channel.
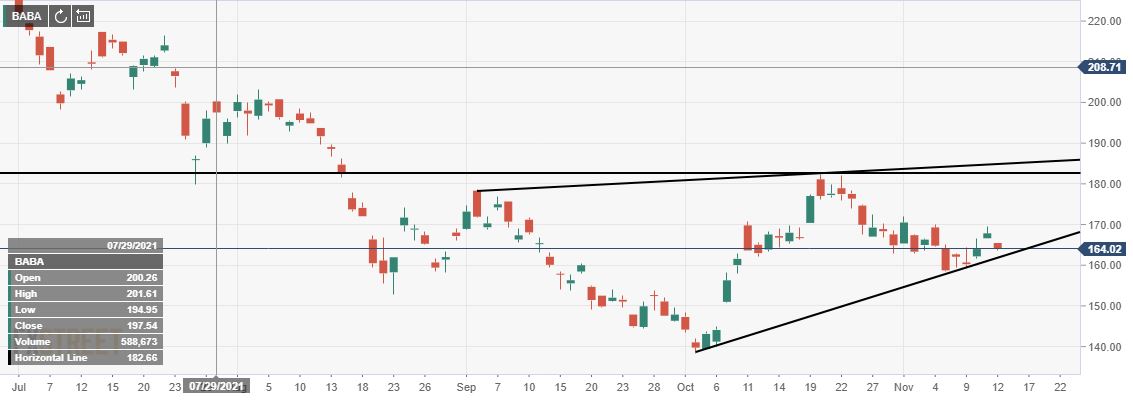
BABA daily chart
Premium
You have reached your limit of 3 free articles for this month.
Start your subscription and get access to all our original articles.
Author

Clay Webster
FXStreet
Clay Webster grew up in the US outside Buffalo, New York and Lancaster, Pennsylvania. He began investing after college following the 2008 financial crisis.


