AIZ’s 17-year bullish cycle attract buyers from blue box

Assurant Inc. AIZ has maintained a bullish cycle since November 2008, characterized by higher highs and lows. In such a price action sequence, traders should look to buy dips. This post will analyze the current price position within the trend and potential higher targets for traders.
Assurant Inc. (NYSE: AIZ) is a leading global provider of risk management and insurance solutions, serving the housing and lifestyle markets. Headquartered in Atlanta, it operates across Global Housing and Global Lifestyle segments, offering products such as mobile device protection, vehicle service contracts, and renters insurance. With operations in over 20 countries, Assurant partners with major financial institutions and retailers, leveraging data-driven innovation to deliver consistent growth and strong shareholder value.
The all-time bullish cycle for AIZ began in November 2008, when the stock traded at $12.52. From that low, an impulse wave completed for wave (I) at the peak in February 2020 ($146.21). The subsequent wave (II) pullback swiftly reached $76.26 in March 2020. Wave (III) is projected to extend to $287-$417. Between March 2020 and April 2022, another impulse cycle completed for wave I of (III), followed by a pullback for wave II, which concluded in March 2023. Since the low in March 2023, a clear impulse structure has emerged, breaking into a new high for the cycle. The weekly chart below illustrates the sub-waves from the end of wave (II).
AIZ Elliott Wave analysis – Weekly chart updated on 28th October 2025
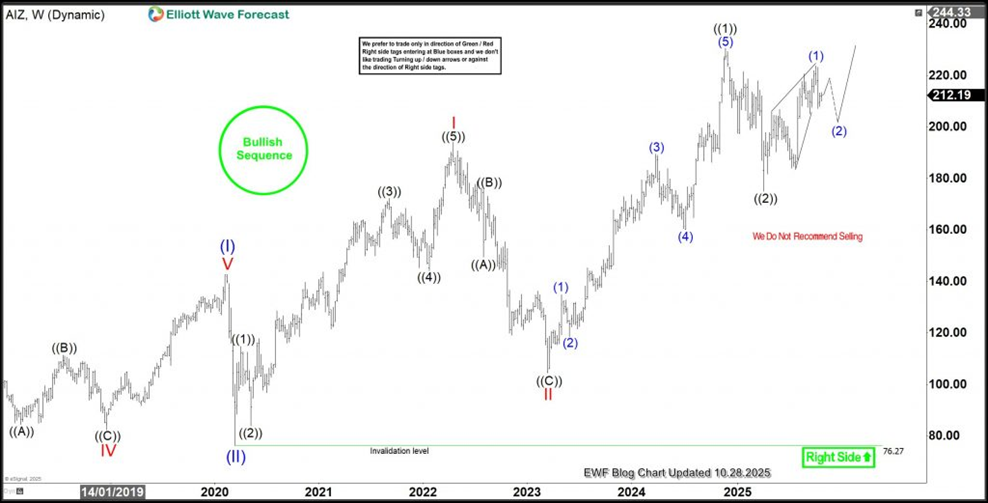
The weekly chart above shows a clear impulse structure completed for wave ((1)) of III. Following this, a 7-swing pullback occurred for wave ((2)), attracting buyers, as seen in the blue box of the daily chart below. With wave ((2)) completed, we should look for higher prices for wave ((3)), targeting at least $300-330. However, alternatively, wave ((2)) could extend deeper into a 15-swing structure if the wave ((1)) high is not breached.
AIZ Elliott Wave Analysis – Daily chart updated on 28th October 2025
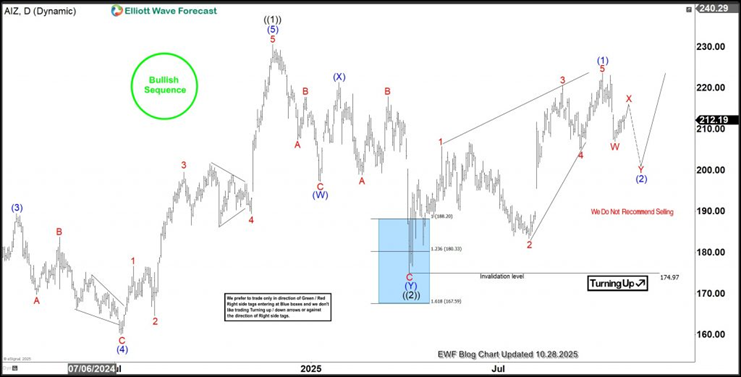
The daily chart above demonstrates how the 7-swing pullback concluded within the blue box, drawing in buyers. The bullish trend remains intact, presenting ample opportunities for buyers to capitalize on pullback extremes. Following the completion of wave ((2)), a 5-wave diagonal concluded for (1). A subsequent pullback for (2) could extend further before potentially breaking to a new high. Traders should either anticipate a new high and then purchase the subsequent dip, or buy if wave ((2)) deepens into a 15-swing structure.
Author

Elliott Wave Forecast Team
ElliottWave-Forecast.com


