Affirm Holdings: Riding the trendline into major resistance

Affirm Holdings (AFRM) has spent the better part of this year grinding higher along a rising daily trend line, and the chart now sits at a decision point between sustained upside and a deeper pullback. The structure is simple: a well‑respected support trend line underneath price and a stack of resistance levels overhead that will determine whether buyers stay in control.
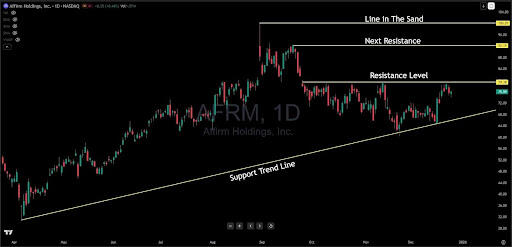
The backbone: rising support
The first feature that stands out on the chart is the clean, upward‑sloping support trend line stretching from the spring lows through multiple pivot lows over the following months. Each time sellers pushed price down into that line, buyers stepped in and defended it, turning potential breakdowns into higher lows. That behavior signals a market that still respects this level as the primary “line of defense” for the existing uptrend.
As long as AFRM stays above this trend line on a daily closing basis, the path of least resistance remains higher, and pullbacks into that zone can be viewed as potential buying opportunities rather than evidence of a broken chart. A decisive daily close below that support, especially on expanding volume, would send a different message: momentum has shifted and the bulls have lost their most important reference point.
The ceiling: first resistance zone
Above current price, the chart marks a horizontal Resistance Level in the high‑70s area, where several prior rallies have stalled and reversed. This is the first major ceiling that has to be cleared before any meaningful trend extension can occur; it is where supply has consistently overwhelmed demand in recent months. The tight clustering of candles around this trendline shows hesitation and back‑and‑forth trading, a sign that both bulls and bears are actively fighting for control.
For active traders, this zone functions as the initial decision area. A rejection here, especially if accompanied by long upper wicks or a sharp intraday reversal, would support the case for another rotation lower toward the rising trend line. Conversely, a strong breakout through this level, with a solid close above and follow‑through the next day, would indicate that sellers are finally being absorbed.
Above resistance: the next upside steps
If AFRM can clear that first resistance trendline, the chart already lays out the next stages of the move with two overhead levels: Next Resistance in the low‑90s and a Line in The Sand near the 100 area. The low‑90s zone lines up with prior price congestion and represents the next likely area where profit‑taking could emerge after a breakout. Think of it as the second step in a staircase: once price climbs above the initial ceiling, this is the next rung where the stock may pause or consolidate.
The “line in the sand” just under 100 is more than just another horizontal line; it marks the top of the broader range visible on the chart and a psychologically important round number. If AFRM reaches this area, the market will be deciding whether this entire advance is just a rally within a larger range or the start of a new, higher price regime. Acceptance above 100 would suggest that buyers are willing to revalue the stock higher, while a hard rejection could trap late longs and lead to a sharper mean‑reversion move.
How traders can frame the setup
From a trading perspective, this chart lends itself to a structured plan built around the clearly defined levels already drawn:
- As long as price holds above the rising support trend line, pullbacks into that area can be viewed as potential long entries with the trend, using the line itself or just below it as a risk marker.
- The high‑70s resistance band is the short‑term inflection point: failure here argues for a move back toward support, while a clean breakout opens room toward the low‑90s.
- The low‑90s and ~100 zones should be viewed as staged profit‑taking and reassessment areas rather than automatic “buy at any price” regions; the higher price climbs, the more critical it becomes to watch how candles react around those levels.
The key takeaway is straightforward: AFRM is in an established uptrend, but it is pressing into significant overhead resistance while leaning on a well‑tested support trend line. The next meaningful signal will come from how price behaves at those yellow lines—either defending support and breaking through resistance, or failing at resistance and slipping back through support, which would mark a change in character for the stock.
The compression is building. Watch how AFRM handles this resistance zone—it'll tell you everything you need to know about where this stock is headed next.
Author

Benjamin Pool
Verified Investing
A seasoned financial expert with a passion for empowering individuals to mastering smart money management.


