$ADM: Buying opportunity in agriculture stock ADM

Archer-Daniels-Midland company, commonly known as ADM, is a multinational food processing and commodities trading corporation. Founded 1902, headquartered in Chicago and traded under the ticker $ADM at NYSE, it is a component of the S&P500 index. First of all, ADM is engaged in corn and oilseeds processing. In general, the products are oils and meals from soybeans, wheat flour, cocoa, sunflower seeds, canola, flaxseeds, peanuts and many others. As a matter of fact, it operates more than 270 plants and 420 crop procurement facilities worldwide. Currently, we can see commodities like soybeans, soybean oil, wheat in a pullback. However, soon support areas should be reached and another bullish cycle may take place. Therefore, an investment in shares of an agriguctural company can provide an exposure to the rising prices in this segment. Hereby, ADM as a market leader should remain an excellent investment candidate. In the initial article from September 2020, we have forecasted a huge potential to the upside within new buyllish cycle from March 2020 lows. We were right. An impulse has brought prices to the new all-time highs at 98.88. From April 2022 highs, we see a medium-term pullback taking place. It provides next buying opportunity in Agriculture Stock Archer-Daniels-Midland. In this blog, we provide an update while discussing the wave structure, buying setup and the upside targets.
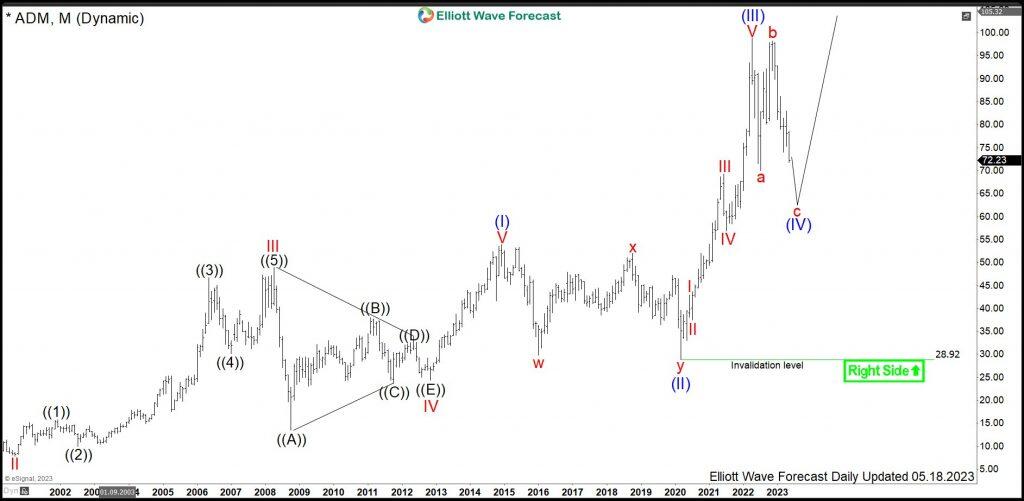
ADM Monthly Elliott Wave Analysis 05.18.2023
The monthly chart below shows the ADM shares $ADM traded at New York Stock Exchange. From the all-time lows, the stock price has developed a cycle higher in wave (I). It has ended in December 2014 at 53.91. Within the impulsive advance in wave (I), all the internals I, III and V are impulsive waves, too. While the wave II is a straightdown correction, the wave IV can be seen as a contracting triangle pattern. From the 2014 highs, a correction lower in wave (II) has unfolded as a double three correction being a 3-3-3 structure. It has found its bottom in March 2020 at 28.92.
From the March lows, a new cycle in wave (III) has developed another impulse. It has printed the all-time highs in April 2022 at 98.88. From there, a pullback against March 2020 lows is taking place and should find support in 3 or 7 swings. It is the preferred view that the pullback is blue wave (IV). Once finished, expect blue wave (V) towards 98.88 highs and beyond. Alternatively, cycle higher from March 2020 can become red wave I and correction from April 2020 can be a red wave II. While main view favors a more conservative upside, the alternative view suggests an accelleration in red wave III of blue wave (III).
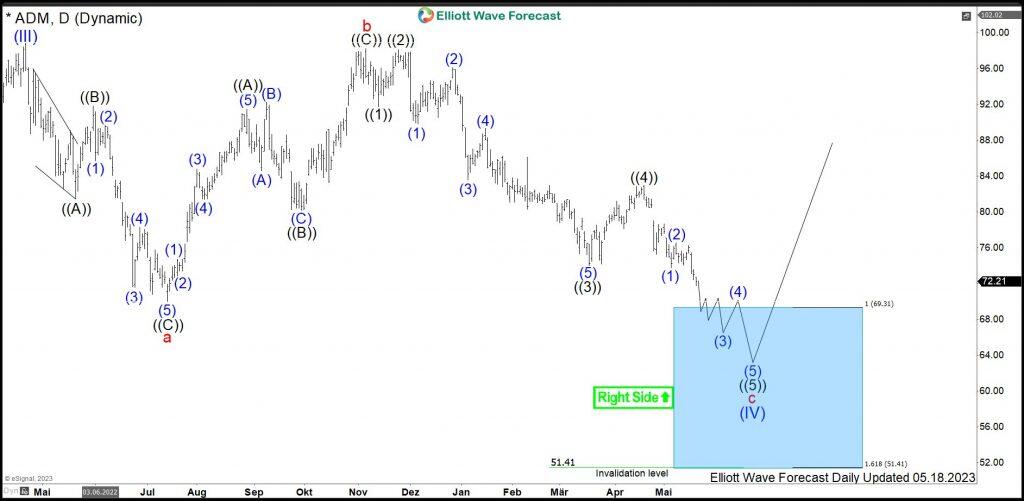
ADM Daily Elliott Wave Analysis 05.18.2023
The Daily chart below shows the correction in 3 swings from April 2022 highs in more detail. The consolidation pattern unfolds as a regular flat structure. Firstly, 3 swings of red wave a have ended in July 2022 at 70.02 lows. Secondly, a bounce in 3 swings has set a connector in November 2022 at 98.28 highs. From there, 3rd swing lower is unfolding as an impulse. It should extend lower and find buyers from the blue box support area. There, a new rally in blue wave (V) should take place.
Investors and traders can be looking to buy $ADM from 69.31-51.41 area. The target for blue wave (V) will be 105.90-117.20 area and possibly higher.
Author

Elliott Wave Forecast Team
ElliottWave-Forecast.com


