AAPL Elliott Wave technical analysis [Video]
![AAPL Elliott Wave technical analysis [Video]](https://editorial.fxstreet.com/images/Markets/Equities/Industries/CommunicationServices/mobile-phone-637435389695511071.jpg)
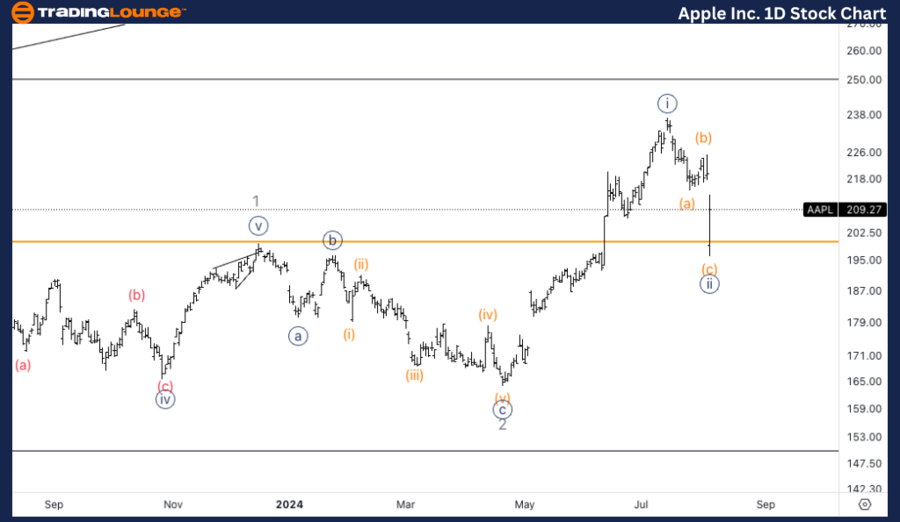
AAPL Elliott Wave Analysis Trading Lounge Daily Chart,
Apple Inc., (AAPL) Daily Chart.
AAPL Elliott Wave technical analysis
Function: Counter Trend.
Mode: Corrective.
Structure: ZigZag.
Position: Wave {ii}.
Direction: Bottom in wave {ii}.
Details: We are looking for further upside to follow, despite the latest news about Warren Buffet selling half his Apple stake. The alternate count forecasts an ending diagonal in wave (5), which would take us higher but with limited upside.
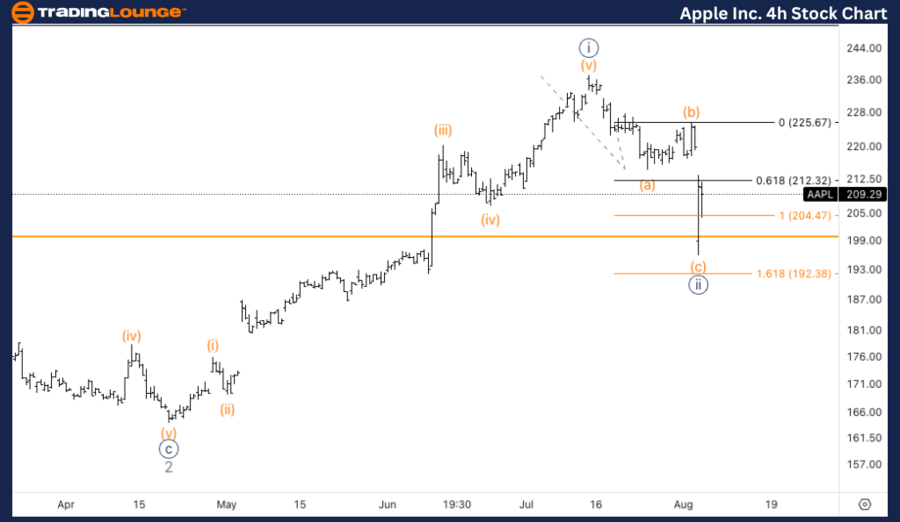
AAPL Elliott Wave Analysis Trading Lounge 4H Chart,
Apple Inc., (AAPL) 4H Chart.
AAPL Elliott Wave technical analysis
Function: Counter Trend.
Mdoe: Corrective.
Structure: ZigZag.
Position: Wave (c) of {ii}.
Direction: Bottom in wave (c).
Details: We have reacted off equality of (c) vs. (a) as well as TL2 at 200$. We are looking for that level to hold in order to project further upside.
Welcome to our latest Elliott Wave analysis for Apple Inc. (AAPL) as of August 6, 2024. This analysis provides an in-depth look at AAPL's price movements using the Elliott Wave Theory, helping traders identify potential opportunities based on current trends and market structure. We will cover insights from both the daily and 4-hour charts to offer a comprehensive perspective on AAPL's market behavior.
AAPL Elliott Wave technical analysis – Daily chart
Despite recent news about Warren Buffet selling half of his Apple stake, the analysis suggests further upside to follow. An alternate count forecasts the possibility of an ending diagonal in wave (5), which would take prices higher, though with limited upside potential. The current wave {ii} correction seems to be nearing completion, setting the stage for a potential resumption of the upward trend.
AAPL Elliott Wave technical analysis – Four-hour chart
The 4-hour chart shows a reaction off the equality of (c) vs. (a), as well as the trendline (TL2) at $200. This level is crucial for the expected upward projection. Holding above $200 is essential for confirming the bottom of wave (c) and supporting the case for further upside.
Technical analyst: Alessio Barretta.
AAPL Elliott Wave technical analysis [Video]
Author

Peter Mathers
TradingLounge
Peter Mathers started actively trading in 1982. He began his career at Hoei and Shoin, a Japanese futures trading company.


