How to leverage solar cycle 25 for investing in Dow and beyond in 2024: Sunspot cycle and market returns

This post probes the complex interplay between sunspot activity and market prices, questioning the oversimplified view of solar maximums and minimums as mere guiding US stock market trends or pivot triggers. We at Gann Explained delve into this nuanced connection, utilizing historical data from solar cycles 21-24 to shed light on the potential influences of the current Solar Cycle 25 on the 2024 market trend.
The never-revealed secret: Influence of solar cycles on the financial market explained
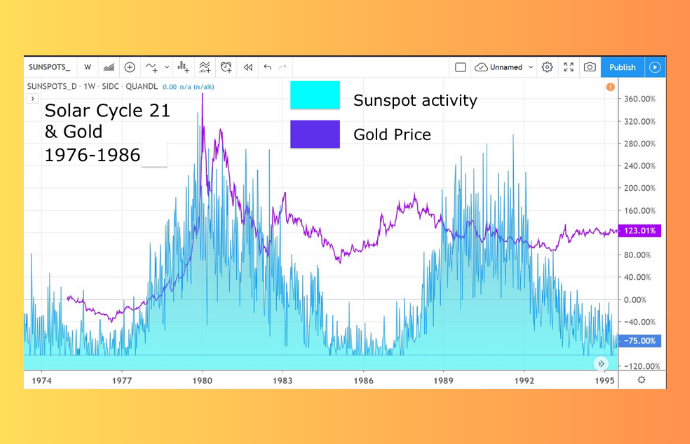
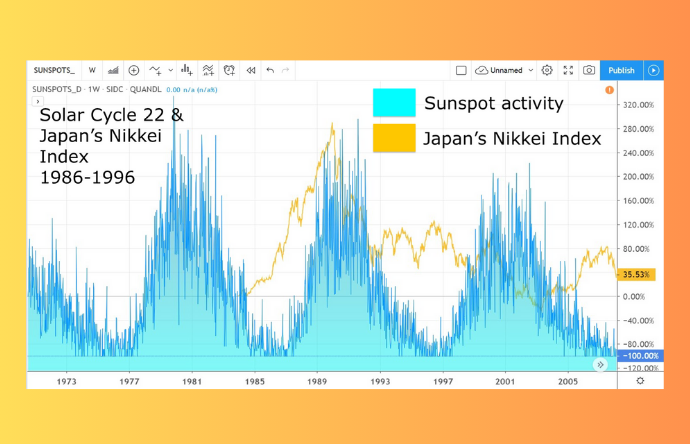
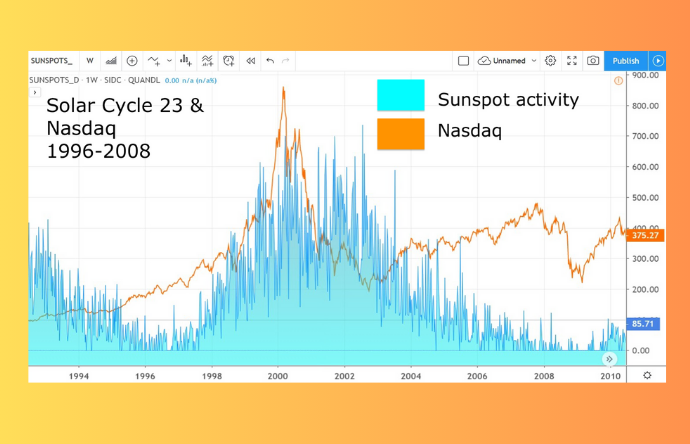
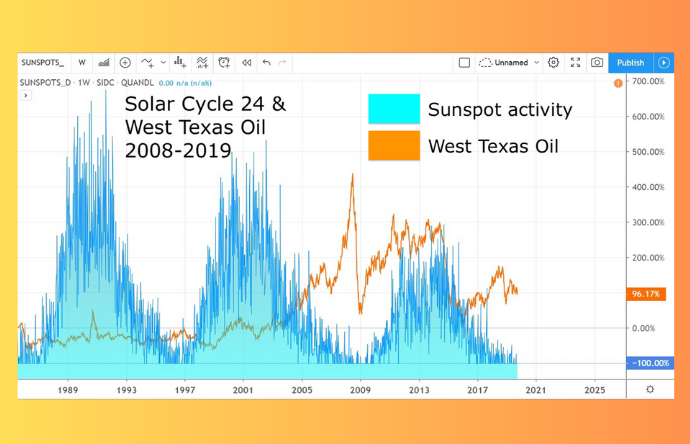
The Solar Cycle doesn't directly dictate stock market trends. Instead, each solar maximum and minimum uniquely align with the peaks and bottoms of specific financial assets. For instance, Gold, the Nikkei Index, Nasdaq, and West Texas oil have each demonstrated distinct correlations with solar cycles 21, 22, 23, and 24, respectively.
Solar Cycle 21 and Gold: A clear correlation between sunspot activity and gold prices was observed, with price movements echoing solar patterns.
Solar Cycle 22 and Japan’s Nikkei Index: This cycle saw the Nikkei Index's performance aligning with sunspot activity trends.
Solar Cycle 23 & Nasdaq: Nasdaq's rise and fall mirrored the solar activity, particularly during the dot-com bubble.
Solar Cycle 24 and West Texas Oil: Oil prices reflected the solar cycle's pattern, with similar growth and decay phases.
Market outlook by gann explained: Tracking solar cycle 25's market influence in 2024
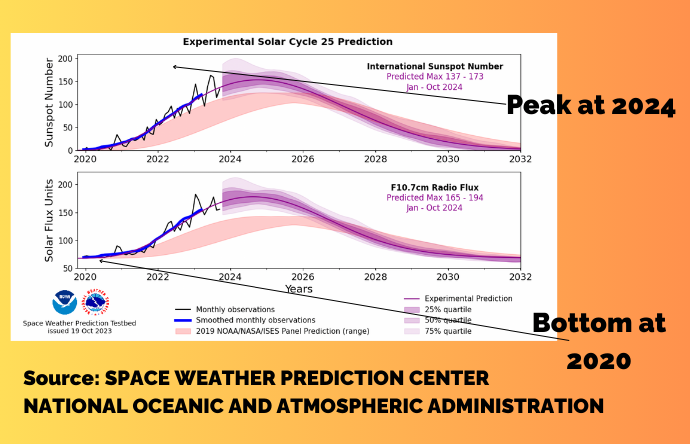
Solar Cycle 25 commenced with its solar minimum phase in 2020, and with NOAA's recent projections pointing to a peak between January and October 2024, the question arises: how will this influence the market?
Pro-Tip: To conduct this analysis and projection, we assess a broad spectrum of financial assets. We focus on identifying those who experienced their lowest points in 2020 and are currently on a consistent upward trajectory, reaching new highs or approaching their peak during this ongoing phase.
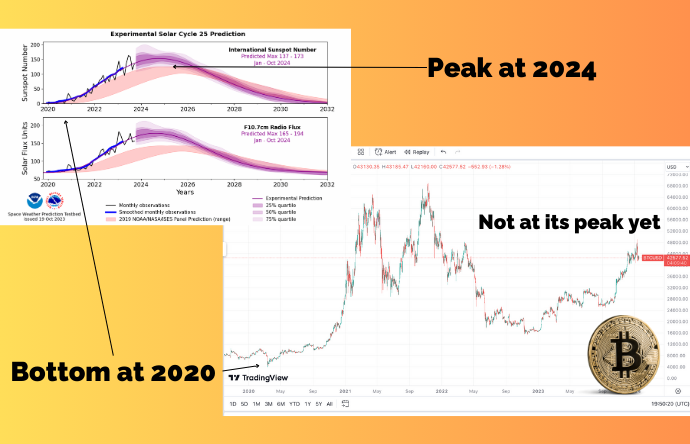
Bitcoin and Solar Cycle 25: Currently, Bitcoin does not show a clear alignment with the Sunspot cycle, presenting an anomaly in the pattern.
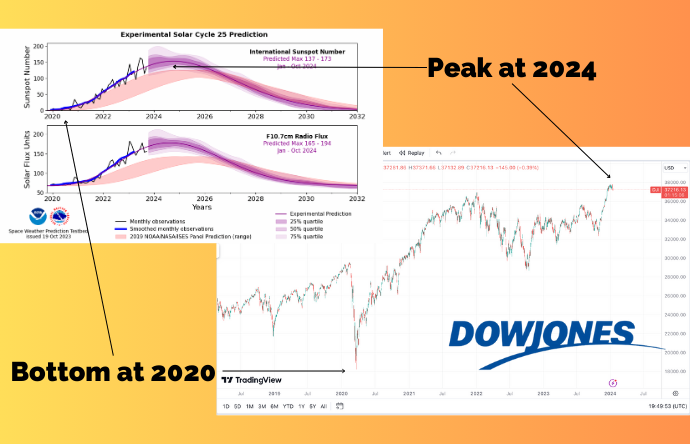
Dow Jones Industrial Average: The Dow experienced lows in early 2020 and is currently peaking, possibly in sync with the solar cycle.
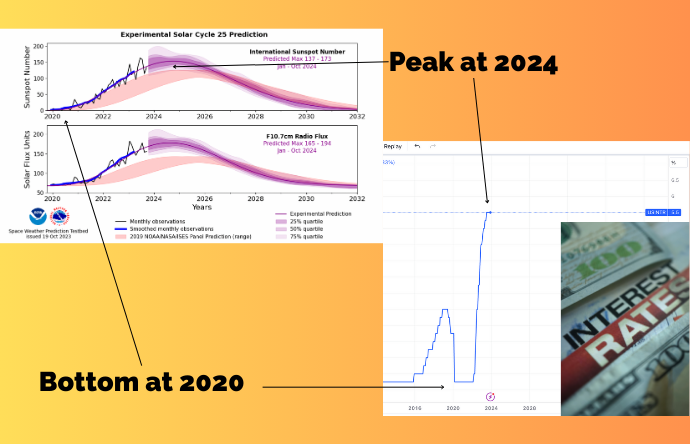
US Interest Rates: Similar to the Dow, interest rates bottomed in early 2020 and are now rising, possibly following the solar pattern.
3 Tips for Trading in Solar Cycle 25
#1. Stay Updated with NOAA Forecasts: Regularly check the NOAA's monthly updated sunspot forecasts to stay ahead.
#2. Match Financial Assets with Solar Cycles: Identify and track the price movements of assets that correlate with Solar Cycle 25. Remember, the impact of this cycle will eventually diminish, underlining the importance of deepening your understanding of cyclical influences in the market
#3. Expand Your Perspective: This analysis aims to provide W.D. Gann traders with an expanded understanding of Gann's cycle theory, particularly in its connection to the narrative elements like the Appearance, Disappearance, and Reappearance of Marie in "The Tunnel Thru the Air." At Gann Explained, our mission is to offer a fresh perspective on Gann's work, going beyond a literal interpretation of his texts and delving into the deeper, more nuanced meanings and applications in trading strategies.
Conclusion:
While the Solar Cycle's influence on markets is not a straightforward cause-and-effect relationship, its correlation with financial trends cannot be overlooked. By understanding and incorporating these natural cycles into market analysis, you can gain a unique perspective and edge in your investing and trading.
Next Steps:
To determine if the stocks, indices, or commodities in your portfolio align with the solar maxima and minima of Solar Cycle 25, look into whether they experienced a significant low in early 2020 and are currently peaking or making new highs. It's crucial to remember that the influence of this cycle may not be constant and will switch off. Always stay mindful of your risk tolerance and ensure you implement a stop-loss strategy for added security.
Author

Khit Wong
Gann Explained
As a noted expert on FXStreet.com and in “Technical Analysis of Stocks & Commodities” and "Traders World," I specialize in applying W.D. Gann's complex theories to practical trading.


