The complacency trade: Why aren't stocks afraid anymore? (US30 vs XAU)

Markets have a funny way of normalizing chaos. If you looked only at the headlines this summer, you would expect global capital markets to be locked in a perpetual defensive crouch. Persistent security bottlenecks in maritime trade corridors, stubborn energy price volatility fueled by renewed Middle East tensions, stock market reactions, and renewed inflation concerns tied to volatile energy prices have kept the macro backdrop thoroughly complicated. Yet, Wall Street’s premier indices continue to look past the noise, prompting many to wonder whether current behavior amounts to textbook market complacency.
Decoding the disconnect in stocks vs Gold
The most striking feature of mid-2026 price action is the decoupling between equity resilience and traditional risk-off barometers. Earlier in the year, the first waves of geopolitical uncertainty helped drive demand for defensive assets. By summer, however, the market’s response had become more complicated as higher oil prices also revived inflation and rate-hike concerns. However, while equities faced periodic pressure—such as pullbacks on July 13 and July 20 amid oil spikes—the Dow Jones has repeatedly recovered from conflict-driven selloffs and remained close to record territory, suggesting that investors still treat geopolitical shocks as episodic rather than systemic. Even so, the Dow Jones remains near record territory while bullion digests a heavy correction from its early-year highs, prompting analysts to examine why gold is not rising despite persistent regional friction.
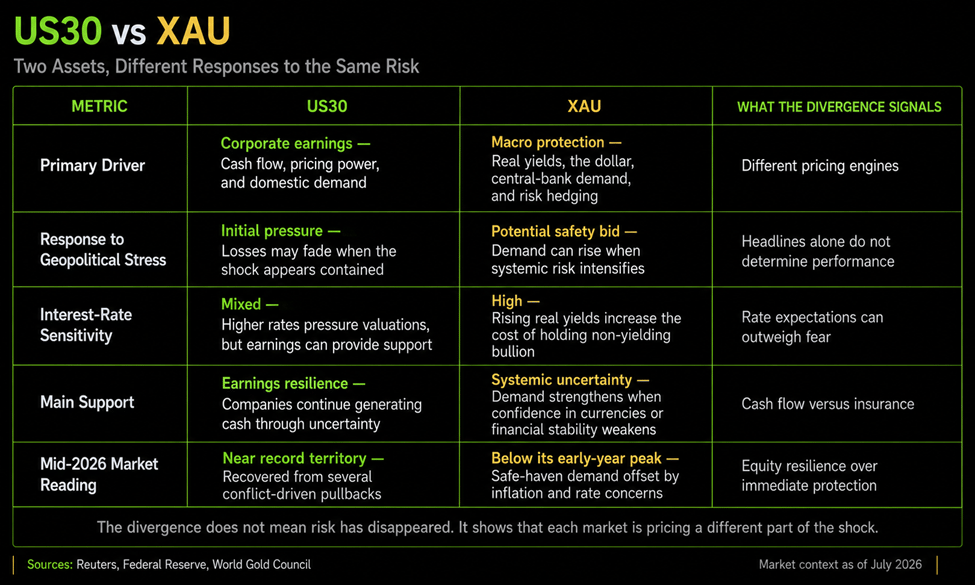
To understand this dynamic, we have to look closely at gold safe haven demand. When systemic shocks first hit, capital rushed into bullion as an emergency insurance policy. But insurance is expensive to hold when opportunity costs rise. As higher oil prices revived expectations that the Federal Reserve might keep policy restrictive or even raise rates, real yields climbed and increased the opportunity cost of holding a non-yielding asset.
This creates a fascinating structural divergence when analyzing gold vs. the Dow Jones. While the blue-chip index continues to shrug off geopolitical background radiation, precious metals are caught between lingering macro fears and the harsh reality of restrictive monetary policy, highlighting a clear gold stock market divergence that challenges the simplistic assumption that geopolitical stress must always lift gold and weaken equities.
The shifting narrative of Gold and stock market correlation
There is no permanent seesaw between gold and stocks. At times they move apart, at times together, depending on whether earnings, real yields, the dollar, or geopolitical stress carries the most influence. The current divergence fits that uneven history.
Markets still react when tensions rise, but the reaction has become shorter. Investors price the initial disruption, judge whether it threatens energy flows or corporate profits, and quickly return to the numbers coming from companies and central banks. That habit has created visible stock market complacency. Severe outcomes remain possible, yet they are repeatedly treated as distant risks rather than part of the base case.
The gap between the Dow Jones vs. gold captures the result. Dow blue chips have outperformed bullion in 2026 as confidence in pricing power, productivity, and domestic demand has held up. Traditional hedges have not disappeared from portfolios, but cash-flow generation has remained the stronger draw.
Geopolitics, repricing, and asset behavior
Why does the broader market appear so immune to headlines that historically trigger panic? Part of the answer lies in how modern portfolios handle external shocks. Repeated episodes of escalation followed by partial de-escalation have encouraged investors to distinguish temporary disruptions from shocks capable of materially damaging earnings or global energy supply. The US30 vs. XAU Versus Trade framework captures this tension by placing equity resilience directly against gold’s shifting response to geopolitical stress.
When evaluating risk assets vs safe haven assets, macro traders aren't just looking at headline fear; they are weighing tangible cash yields against static stores of value. The underlying US30 and XAU asset comparison reveals two entirely different philosophical bets on the global economy:
- US30: A bet on corporate pricing power, nominal growth, and the ability of major firms to pass inflationary costs onto consumers.
- XAU: Exposure to real-rate expectations, currency risk, central-bank demand, and demand for protection against financial or geopolitical shocks.
US30 outperforming gold amid active military tensions suggests that earnings resilience and rate expectations are carrying more weight than the rush for geopolitical cover.
Why the divergence matters moving forward
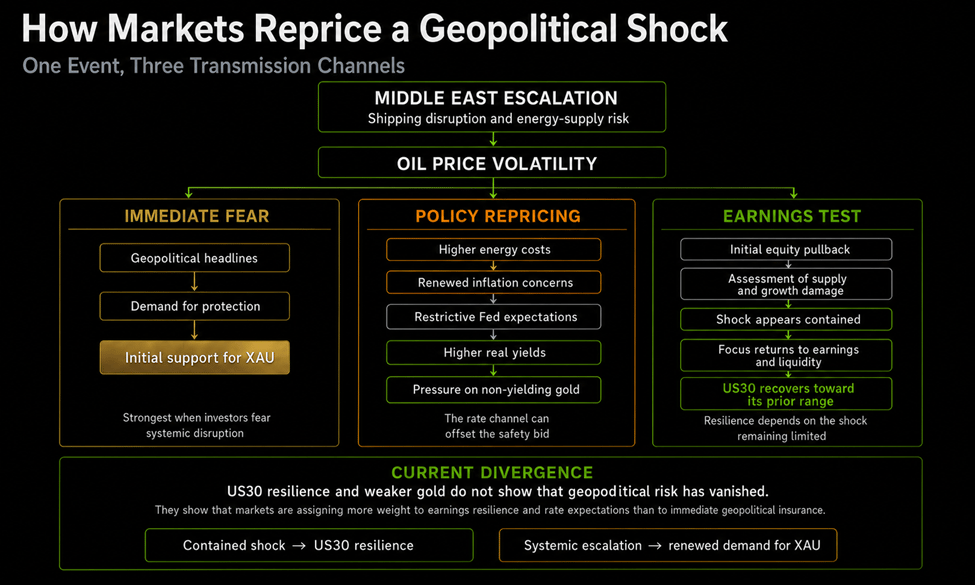
The million-dollar question for portfolio managers is whether this calm is sustainable or if we are simply witnessing a delayed geopolitical risk repricing. According to the World Gold Council Mid-Year Outlook, gold remains highly sensitive to shifts in rate expectations and central-bank demand, even as geopolitical premiums ebb and flow.
Similarly, Reuters reported on July 23 that rising energy costs were reinforcing inflation concerns and expectations of higher interest rates, pressuring non-yielding bullion even as geopolitical risks remained elevated. The recent gold reaction to geopolitical risk shows how inflation and interest-rate expectations can outweigh safe-haven demand, forcing traders to reassess how stock market geopolitical risk is reflected across asset classes.
If you are looking to trade US30 vs XAU with versus trade structures, respecting this dual reality is critical. Markets may currently be ignoring the drums of war in favor of earnings, but sentiment can pivot overnight. Evaluating the US30 vs. XAU requires looking past the surface to understand why stocks ignore geopolitical risk in favor of corporate cash flow. Whether you use a versus pair, US30 vs XAU, or execute a targeted versus trade, US30 vs XAU, the prevailing trend suggests that Wall Street prefers growth over gold, leaving structural skeptics wondering how long this equilibrium can hold.
Author

Amir Razak
Versus Trade
Malaysian-born market analyst Amir Razak cuts through the noise every week, breaking down Versus Pairs and explaining what is really driving one asset ahead of another.















