Why position sizing, not entry signals, decides your drawdown

Most traders spend the overwhelming majority of their energy on the entry. The perfect setup, the confluence, the signal that finally works. It's understandable — the entry is the visible, exciting part of trading. But if you examine what actually determines whether an account survives a losing streak, the entry is rarely the deciding factor.
Position sizing is.
Consider two traders taking the exact same entries on gold or a major FX pair over the same period. Same signals, same market, same sequence of winners and losers. One ends the year compounding steadily; the other blows the account. The only variable that differs is how much each risked per trade. That single choice, repeated across hundreds of positions, is the difference between survival and ruin — and it has nothing to do with the quality of the entries, which were identical.
Drawdown is a sizing problem, not a strategy problem
When a strategy hits a painful drawdown, the reflexive conclusion is that the edge has stopped working. Sometimes that's true. Far more often, the edge was intact and the sizing was simply wrong for the volatility regime.
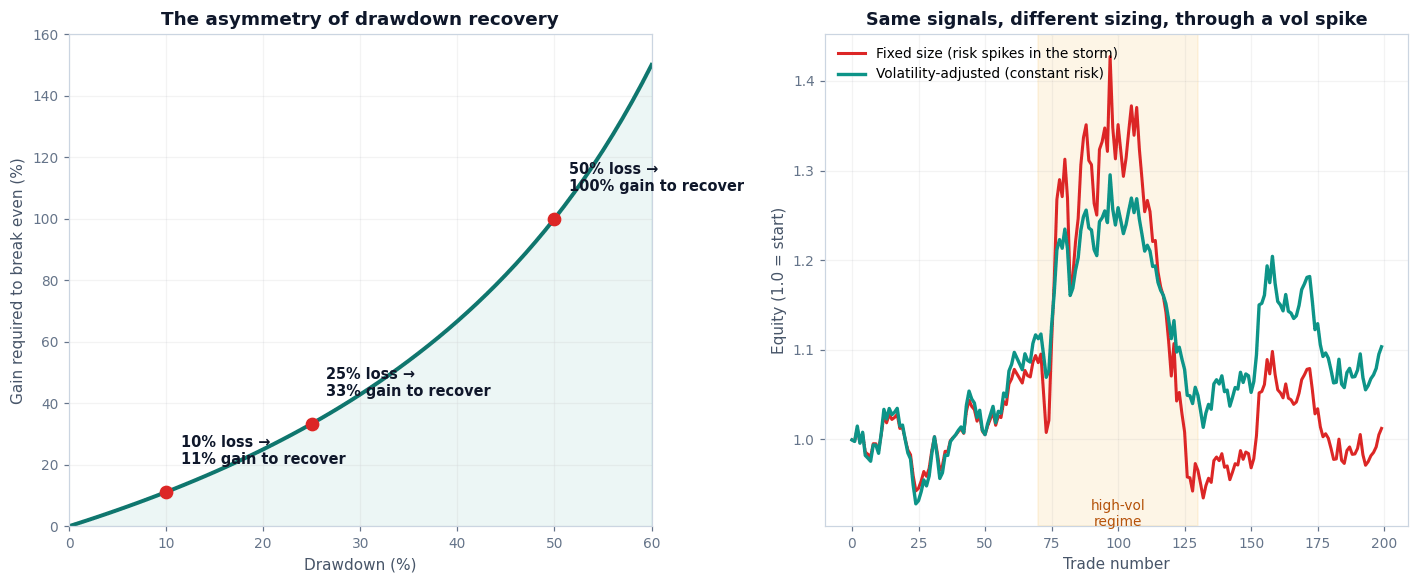
Take a systematic approach on XAU/USD. Gold's average daily range swings dramatically between quiet consolidation and news-driven expansion — and around major catalysts, that range can roughly double. A fixed position size that feels comfortable during a tight range becomes reckless when the range expands. The trader changed nothing; the market did. But the effective risk per trade silently multiplied, because the position was never sized to current conditions.
This is why professional systematic strategies size against volatility rather than against conviction. When the market gets wild, the position shrinks; when it calms, the position grows. The entry logic stays identical throughout. Only the exposure adapts. A trader who ignores this is, in effect, running a different and riskier strategy every time volatility rises — without ever deciding to.
The math that ends accounts
The reason sizing carries such weight comes down to the asymmetry of recovery, which is unforgiving and non-linear.
A 10% drawdown requires an 11% gain to recover. A 25% drawdown requires 33%. A 50% drawdown requires a 100% gain — you have to double what remains simply to return to the starting point. Every increment of drawdown makes the climb back disproportionately harder.
This is the mathematical case for prioritizing the depth of the hole over the height of the peak. A strategy that earns slightly less but never digs a deep drawdown will outcompound one that reaches for maximum return and periodically craters — not because it wins more often, but because it never has to fight its way out of a 50% grave. Capping drawdown depth is not caution for its own sake; it is the single highest-leverage decision in long-term compounding.
For traders on funded and prop accounts, the asymmetry is even sharper. A trailing drawdown limit is not a psychological threshold that can be endured — it is an account-ending line. Size for that limit, or the limit eventually finds you, usually on the day volatility expands and a "normal" position becomes an oversized one.
What this looks like in practice
The practical shift is simple to state and genuinely difficult to execute: decide your risk before your position size, and let volatility set the size.
Instead of "I'll trade my usual size because that's what I always trade," the logic becomes "I'm risking a fixed fraction of the account on this trade; given where my stop must sit and how volatile this instrument is right now, that dictates the position size." When the market forces a wider stop, the position automatically gets smaller. Risk stays constant; size flexes to keep it that way.
Done consistently, this produces something quietly powerful: it makes the worst losing streak survivable by design rather than by luck. The strategy's job is to find the edge. Sizing's job is to ensure the account is still alive when that edge eventually pays off.
The takeaway
Entry signals get the attention because they're the part of trading that feels like skill. But the trader who masters position sizing — risking a constant fraction, sizing against volatility, and respecting what drawdown does to recovery math — will outlast the trader with a sharper signal and worse risk control every single time.
The edge tells you when to trade. Sizing decides whether you're still trading a year from now.
Author

Puravida Edge Analysis Team
Puravida Edge
The Puravida Edge Analysis Team researches systematic trading approaches for prop firm and funded traders, with a focus on volatility-based position sizing, drawdown control, and Monte Carlo risk modeling across futures and forex markets.















