Evolution of technical analysis: History, methods and modern applications

Technical analysis is the study of historical market data to identify potential future price movements. It examines price action, trading volume, market trends, investor psychology, and recurring chart behavior to estimate the probability of future outcomes.
While the tools used by technical analysts have changed significantly over time, the core idea has remained the same: markets often create recognizable patterns, and those patterns can help traders make more informed decisions.
Today, technical analysis is used across stocks, forex, commodities, cryptocurrencies, indices, and other financial markets. From simple trend lines and chart patterns to advanced indicators and algorithmic models, it has evolved into a widely used framework for analyzing market behavior.
The early history of technical analysis
The roots of technical analysis can be traced back to the late nineteenth century. During this period, traders and market observers began recording price changes and studying them for recurring behavior.
One of the most influential figures in the history of technical analysis was Charles Dow. His work formed the foundation of what later became known as Dow Theory. Dow believed that stock market prices moved in identifiable trends and that these trends reflected broader economic conditions.
Early technical analysis relied heavily on what became known as the “book method.” Traders recorded market price changes manually and looked for patterns in the way prices moved over time. This eventually developed into point and figure charting, one of the earliest formal charting methods. Get to know the best technical analysis books.
Point and figure charts focused on price movement rather than time. They helped analysts identify trend direction, support and resistance levels, breakouts, and possible reversals. Although modern traders often use candlestick or bar charts, point and figure analysis remains relevant for investors who want to focus purely on price movement.
The rise of chart patterns
In the early twentieth century, bar charts became more widely used. This made it easier for analysts to track daily price movement, highs, lows, and closing prices.
As charting became more common, traders began identifying recurring formations in price behavior. These formations later became known as chart patterns.
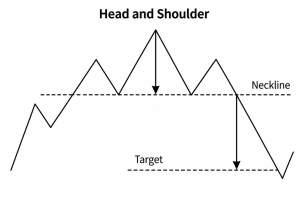
Common chart patterns include head and shoulders formations, double tops, double bottoms, triangles, flags, wedges, and rectangles. While each pattern has its own structure, most chart patterns attempt to answer one of two important questions.
Will the market continue its existing trend?
Or is the market preparing for a reversal?
In other words, chart patterns are used to identify periods of potential price consolidation, trend continuation, or market reversal.
This pattern-based approach remains one of the most recognizable parts of technical analysis today.
Elliott Wave theory and market cycles
One of the most influential developments in the history of technical analysis was Elliott Wave Theory. Developed by Ralph Nelson Elliott during the 1930s, the theory expanded on Dow Theory by suggesting that markets move in repeating price patterns driven by collective investor psychology.
Elliott Wave Theory divides market movement into two broad phases. The first is an impulsive phase, which moves in the direction of the larger trend. The second is a corrective phase, which moves against that trend. In its basic form, an impulsive move is often described as a five-wave structure, while a correction commonly develops in three waves.
The key idea behind Elliott Wave Theory is that market behavior is fractal. A larger trend can contain smaller wave patterns, while those smaller patterns can contain even smaller structures. This allows analysts to study price action across multiple timeframes and identify where a market may be within a broader cycle.
Unlike simple chart patterns, Elliott Wave analysis attempts to provide a framework for both trend continuation and corrective market phases. Traders often combine it with Fibonacci ratios, support and resistance levels, momentum indicators, and volume analysis to identify potential entry areas, invalidation levels, and price targets.
Although Elliott Wave Theory can involve subjective interpretation, it remains widely used by traders who want to understand the structure behind market trends and corrections. Learn more about Elliott Wave Theory and how wave patterns can help analyze market cycles.
Moving averages and the growth of technical indicators
By the 1950s, technical analysis had become more widely accepted among professional market participants. Analysts began using moving averages to smooth out price fluctuations and identify the broader direction of a trend.
A moving average calculates the average price of an asset over a specific period. For example, a 50-day moving average uses the average closing price from the previous 50 trading sessions.
Moving averages became popular because they helped traders identify whether a market was trending higher, lower, or moving sideways.
During the 1960s, technical analysts began experimenting with more advanced variations of moving averages. These included exponentially weighted moving averages, triangular moving averages, and other mathematical approaches designed to react more quickly to changing market conditions.
However, moving averages also had limitations. They often produced delayed signals, false breakouts, and short-lived trading opportunities. High transaction costs also made it difficult for traders to profit from every signal.
These challenges encouraged analysts to develop additional indicators like stock indicators.
The expansion of technical indicators
As computers became more accessible, technical analysts gained the ability to process large amounts of market data quickly. This led to the development and widespread use of technical indicators.
Many indicators are based on closing prices and apply mathematical formulas to identify momentum, volatility, trend strength, and potential turning points.
Popular technical indicators include the Relative Strength Index, Moving Average Convergence Divergence, Bollinger Bands, stochastic oscillators, average true range, and momentum indicators.
Some indicators have shown value in certain market environments, while others have struggled to perform consistently under objective testing.
This is an important point for traders to understand. No technical indicator works perfectly in every market condition. A momentum indicator may perform well in a trending market but produce weak signals in a sideways market. Similarly, a moving average strategy may help identify long-term trends but react too slowly during volatile reversals.
Successful technical analysis often involves combining multiple tools rather than relying on a single indicator.
Technical analysis and quantitative testing
One of the biggest changes in the evolution of technical analysis has been the rise of quantitative testing.
In the past, many technical trading ideas were based on visual observation and experience. Traders identified patterns on charts and developed rules based on what appeared to work.
Modern computing power has made it possible to test these ideas across thousands of historical market scenarios.
Quantitative analysis allows traders to evaluate whether a technical strategy has produced meaningful results over time. Analysts can test chart patterns, indicator signals, trend-following systems, and breakout strategies against historical data.
This process helps traders answer important questions.
- Did the strategy outperform a buy-and-hold approach?
- How often did the signal succeed?
- What was the average return?
- How large were the drawdowns?
- Did the strategy work across different market conditions?
Although backtesting cannot guarantee future performance, it can help traders evaluate whether a trading idea has historical credibility.
Technical analysis in real market trading
Technical analysis has always been closely connected to practical trading.
Many technicians focus less on explaining why a market moves and more on identifying opportunities created by price behavior. This practical mindset is one reason technical analysis remains popular among active traders.
Dow Theory remains an important example. Dow believed that major economic trends would eventually be reflected in the stock market. His approach focused on identifying higher highs, higher lows, lower highs, and lower lows.
These principles remain central to modern trend analysis.
Traders still use price structure to identify whether a market is bullish, bearish, or consolidating. Higher highs and higher lows often suggest an uptrend, while lower highs and lower lows often indicate a downtrend.
Technical analysts have also expanded their work to include volume analysis and market breadth analysis.
Volume can help confirm whether a price move has strong participation. For example, a breakout supported by rising volume may be more meaningful than a breakout that occurs on weak volume.
Market breadth measures how many stocks or assets are participating in a broader market move. Breadth indicators can help traders determine whether a rally is widespread or concentrated in only a small number of securities.
Apply technical analysis with expert market insights
Understanding technical analysis is one thing. Applying it consistently across changing market conditions is another.
At Elliott Wave Forecast, we help traders turn technical analysis concepts into actionable market insights through structured Elliott Wave analysis, market forecasts, and educational resources.
Our members receive coverage across major asset classes, including forex, indices, commodities, stocks, ETFs, and cryptocurrencies. The analysis combines Elliott Wave structure with market cycles, swing sequences, support and resistance, correlations, and technical price action.
Depending on the membership plan, traders can access:
- Daily and weekly Elliott Wave market updates
- Intraday and technical video analysis
- Live analysis sessions and chat rooms
- Blue Box trading areas and market forecasts
- Trading execution tools and educational resources
- Coverage of dozens of global instruments across multiple markets
Whether you are learning technical analysis for the first time or looking to validate your own market view, Elliott Wave Forecast provides a structured way to follow market trends, corrections, and potential trading opportunities.
Behavioral finance and market psychology
Behavioral finance has helped provide a stronger foundation for some technical analysis concepts.
Technical analysis often relies on the idea that investor psychology creates recurring market behavior. Fear, greed, loss aversion, overconfidence, and herd behavior can influence how traders react to price movement.
Support and resistance are often explained through psychology.
A support level is an area where buying interest may increase because traders believe an asset is undervalued or likely to recover.
A resistance level is an area where selling pressure may rise because traders believe an asset is overvalued or likely to struggle.
These levels are not guaranteed turning points. However, they often become important because many traders, investors, and algorithms monitor the same price zones.
Relative strength analysis also has links to modern financial research. Technical analysts use relative strength to identify assets outperforming the broader market. In academic finance, a similar concept is known as the momentum anomaly.
Different terminology may be used, but both approaches recognize that assets showing strength can continue outperforming for a period of time.
The future of technical analysis
Modern technical analysis is becoming increasingly data-driven.
Machine learning, algorithmic trading, artificial intelligence, and advanced statistical tools are allowing analysts to test market behavior in more sophisticated ways. As artificial intelligence continues to reshape financial markets, traders are also watching the companies leading this transformation. Explore our guide to the best AI stocks to learn which names are positioned at the center of the AI growth trend.
One example is volatility-based support and resistance. This approach uses volatility extremes and recent price action to identify potential support and resistance levels.
Unlike traditional chart analysis, volatility-based models can use mathematical rules to define price zones. This makes the process more measurable, repeatable, and easier to test.
Advanced software also allows traders to evaluate technical signals through event testing. Instead of simply observing whether a pattern appears useful, analysts can measure how markets behaved after a signal occurred.
This can help bridge the gap between traditional chart analysis and modern quantitative research.
Conclusion
The evolution of technical analysis reflects the evolution of financial markets themselves.
What began with handwritten price records and point and figure charts has grown into a diverse field that includes chart patterns, moving averages, technical indicators, quantitative testing, behavioral finance, and algorithmic trading.
Technical analysis is not a perfect forecasting tool, and no strategy can predict markets with certainty. However, when applied with disciplined risk management, historical testing, and an understanding of market conditions, it can help traders identify trends, manage risk, and improve decision-making.
As technology continues to advance, technical analysis is likely to become even more sophisticated. The central principle, however, will remain the same: understanding historical market behavior can provide valuable insight into potential future price action.
Author

Elliott Wave Forecast Team
ElliottWave-Forecast.com


