Zcash Price Forecast: ZEC slips amid profit-taking, fading retail demand
- Zcash trims gains after rising to near $450, signaling potential profit-taking.
- ZEC's derivatives market remains strong, but a slight dip in the Open Interest could accelerate the correction.
- The RSI and the MACD indicators on the 4-hour chart highlight a bearish technical structure.

Zcash (ZEC), a privacy-focused token, is trading at around $392 at the time of writing on Monday. This follows a steady price increase over the weekend, during which ZEC approached $450 before correcting in tandem with crypto majors such as Bitcoin (BTC), Ethereum (ETH), and Ripple (XRP).
Establishing a higher support would be crucial for the bulls in the coming days as they push to resume the uptrend above $400.
Zcash wobbles as retail demand slows
Zcash remains one of the best-performing cryptocurrencies in the fourth quarter, up by nearly 425%, according to CryptoRank. The token has sustained two consecutive bullish quarters, highlighting an intentional shift toward privacy blockchains.
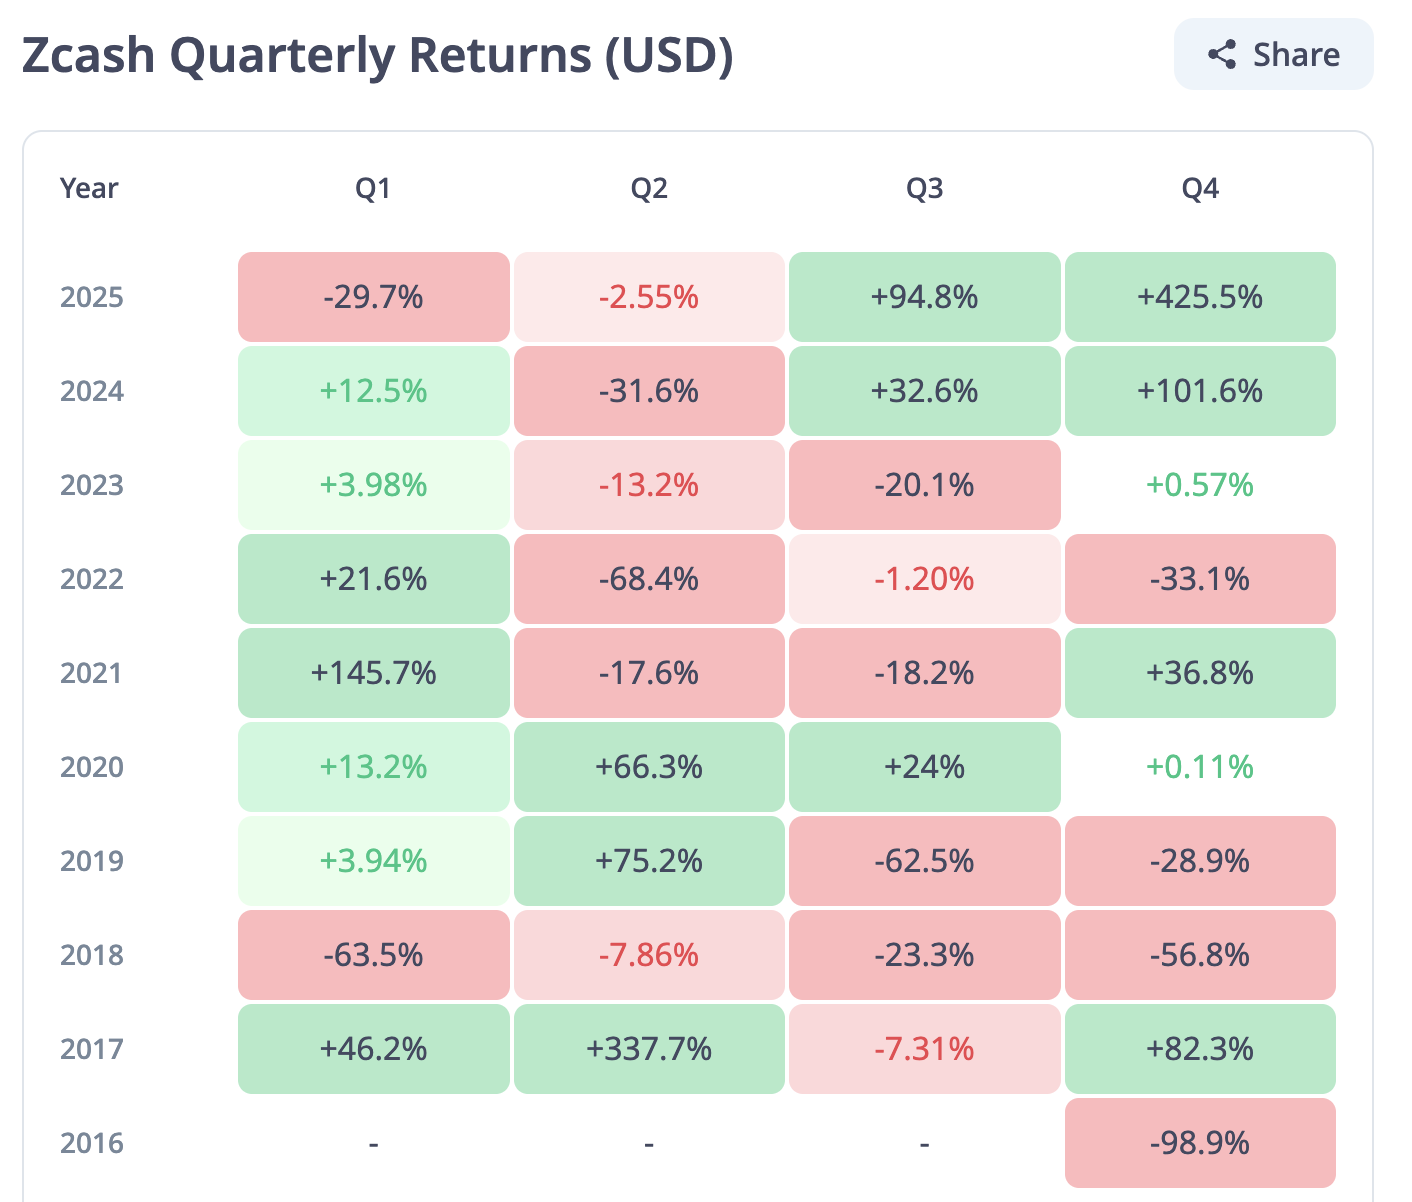
Zcash quarterly returns | Source: CryptoRank
However, CoinGlass data shows that retail demand is wobbling, possibly due to profit-taking as Zcash's price rises. The futures Open Interest (OI), representing the nominal value of outstanding futures contracts, averages $645 million, down from $669 million, its record high reached on Sunday. The OI must steadily increase to support the uptrend. Otherwise, pullbacks would mean that traders are losing conviction in the uptrend.
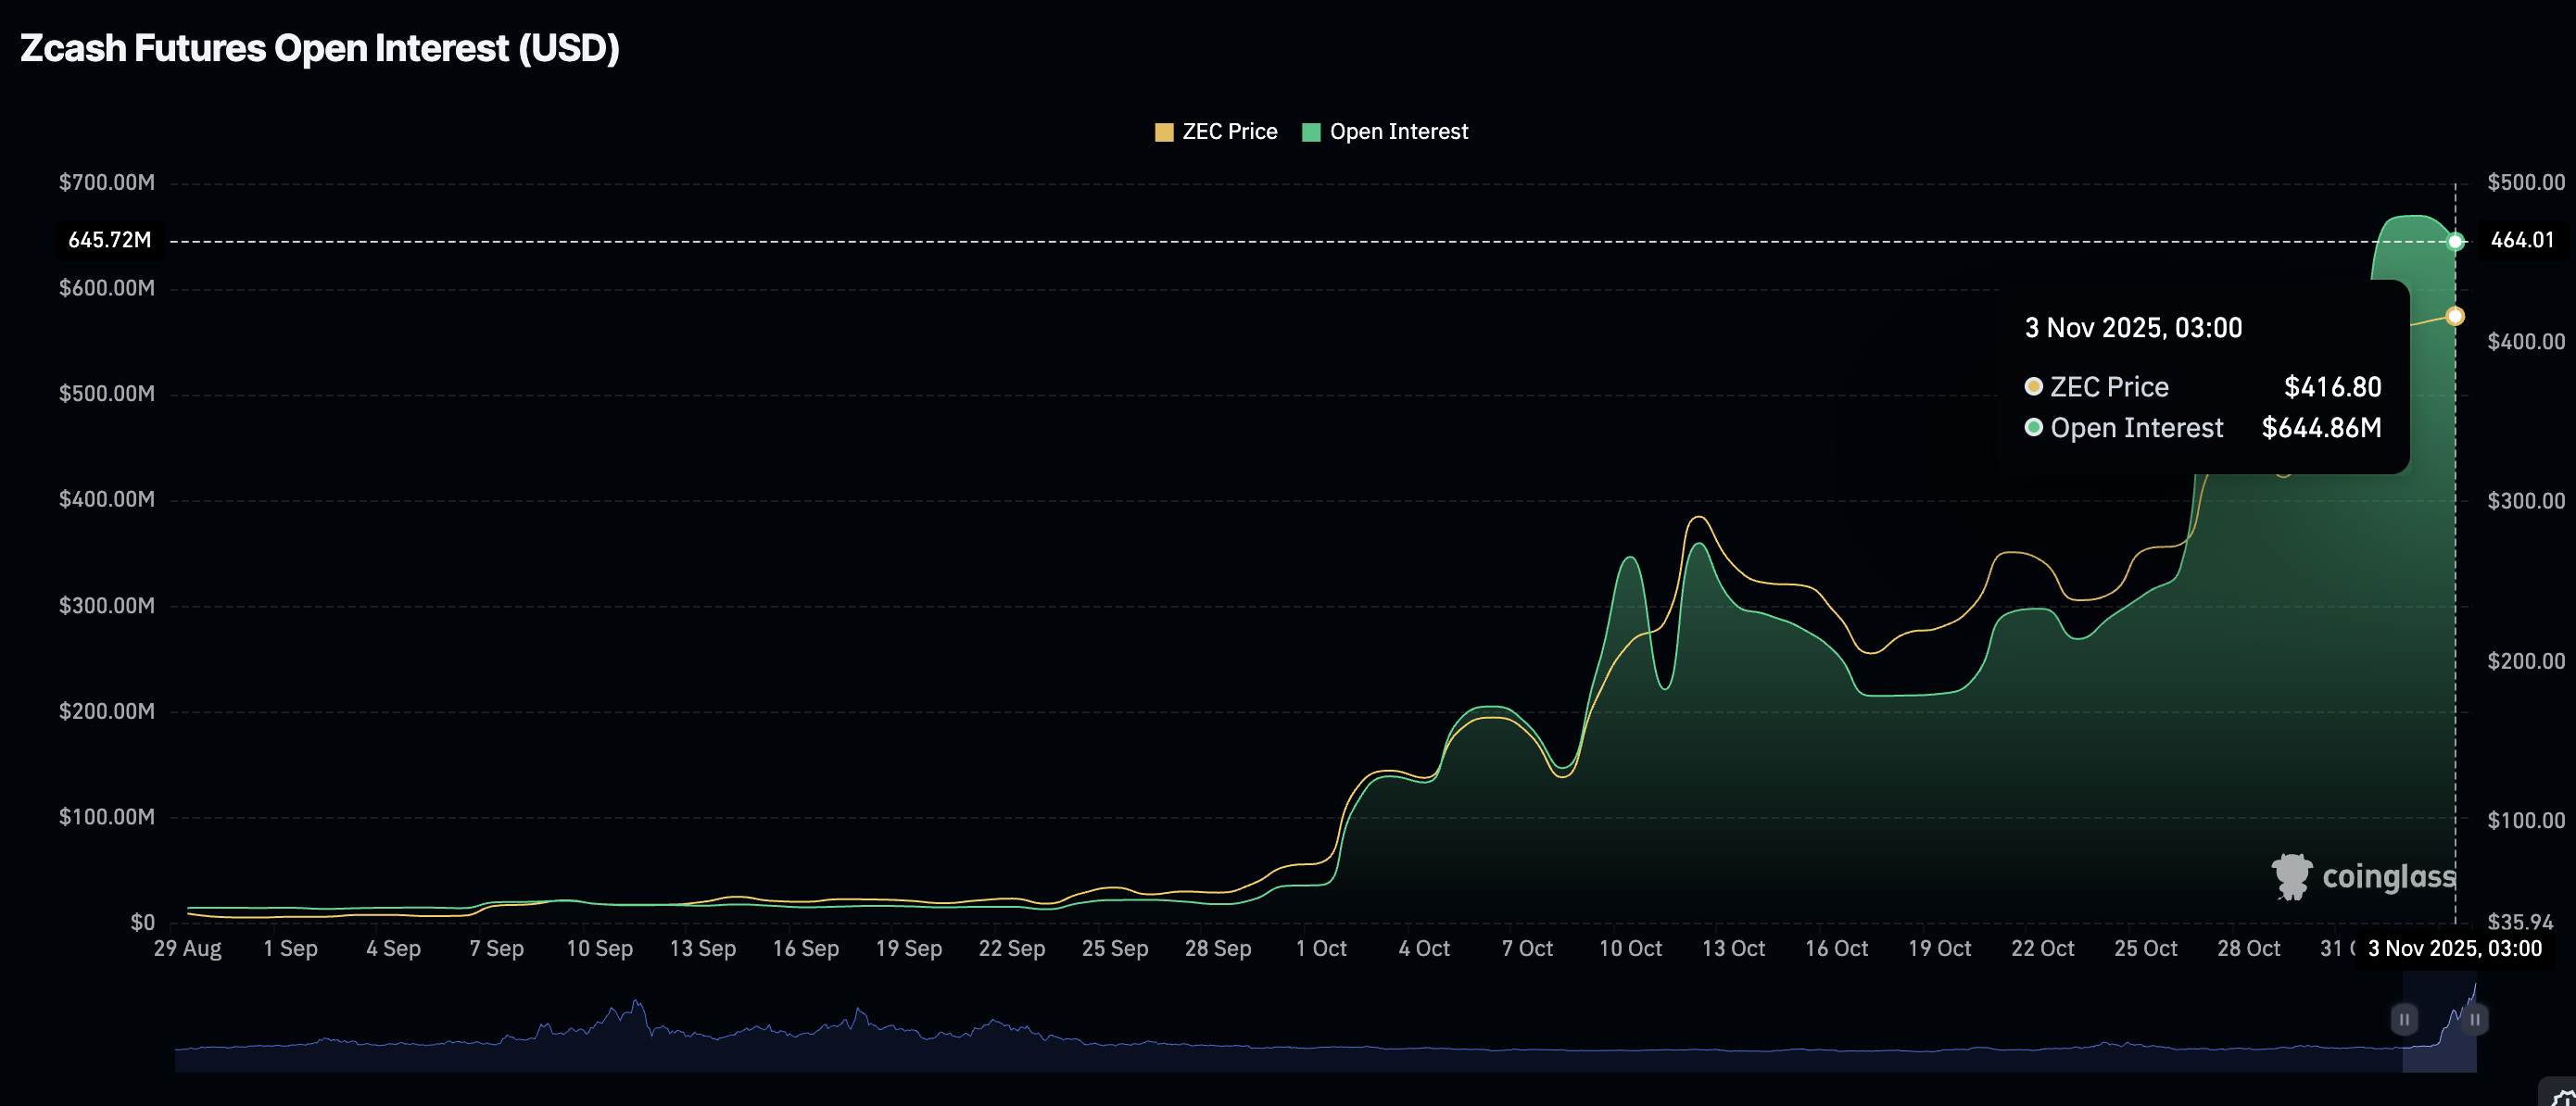
Zcash Open Interest | Source: CoinGlass
On the other hand, the OI-weighted funding rate remains negative despite the Zcash price trading near its all-time high of $449 set on Saturday. Negative funding rates indicate that traders are currently de-risking, hinting at bullish exhaustion. The continued piling into short positions tends to increase selling pressure.
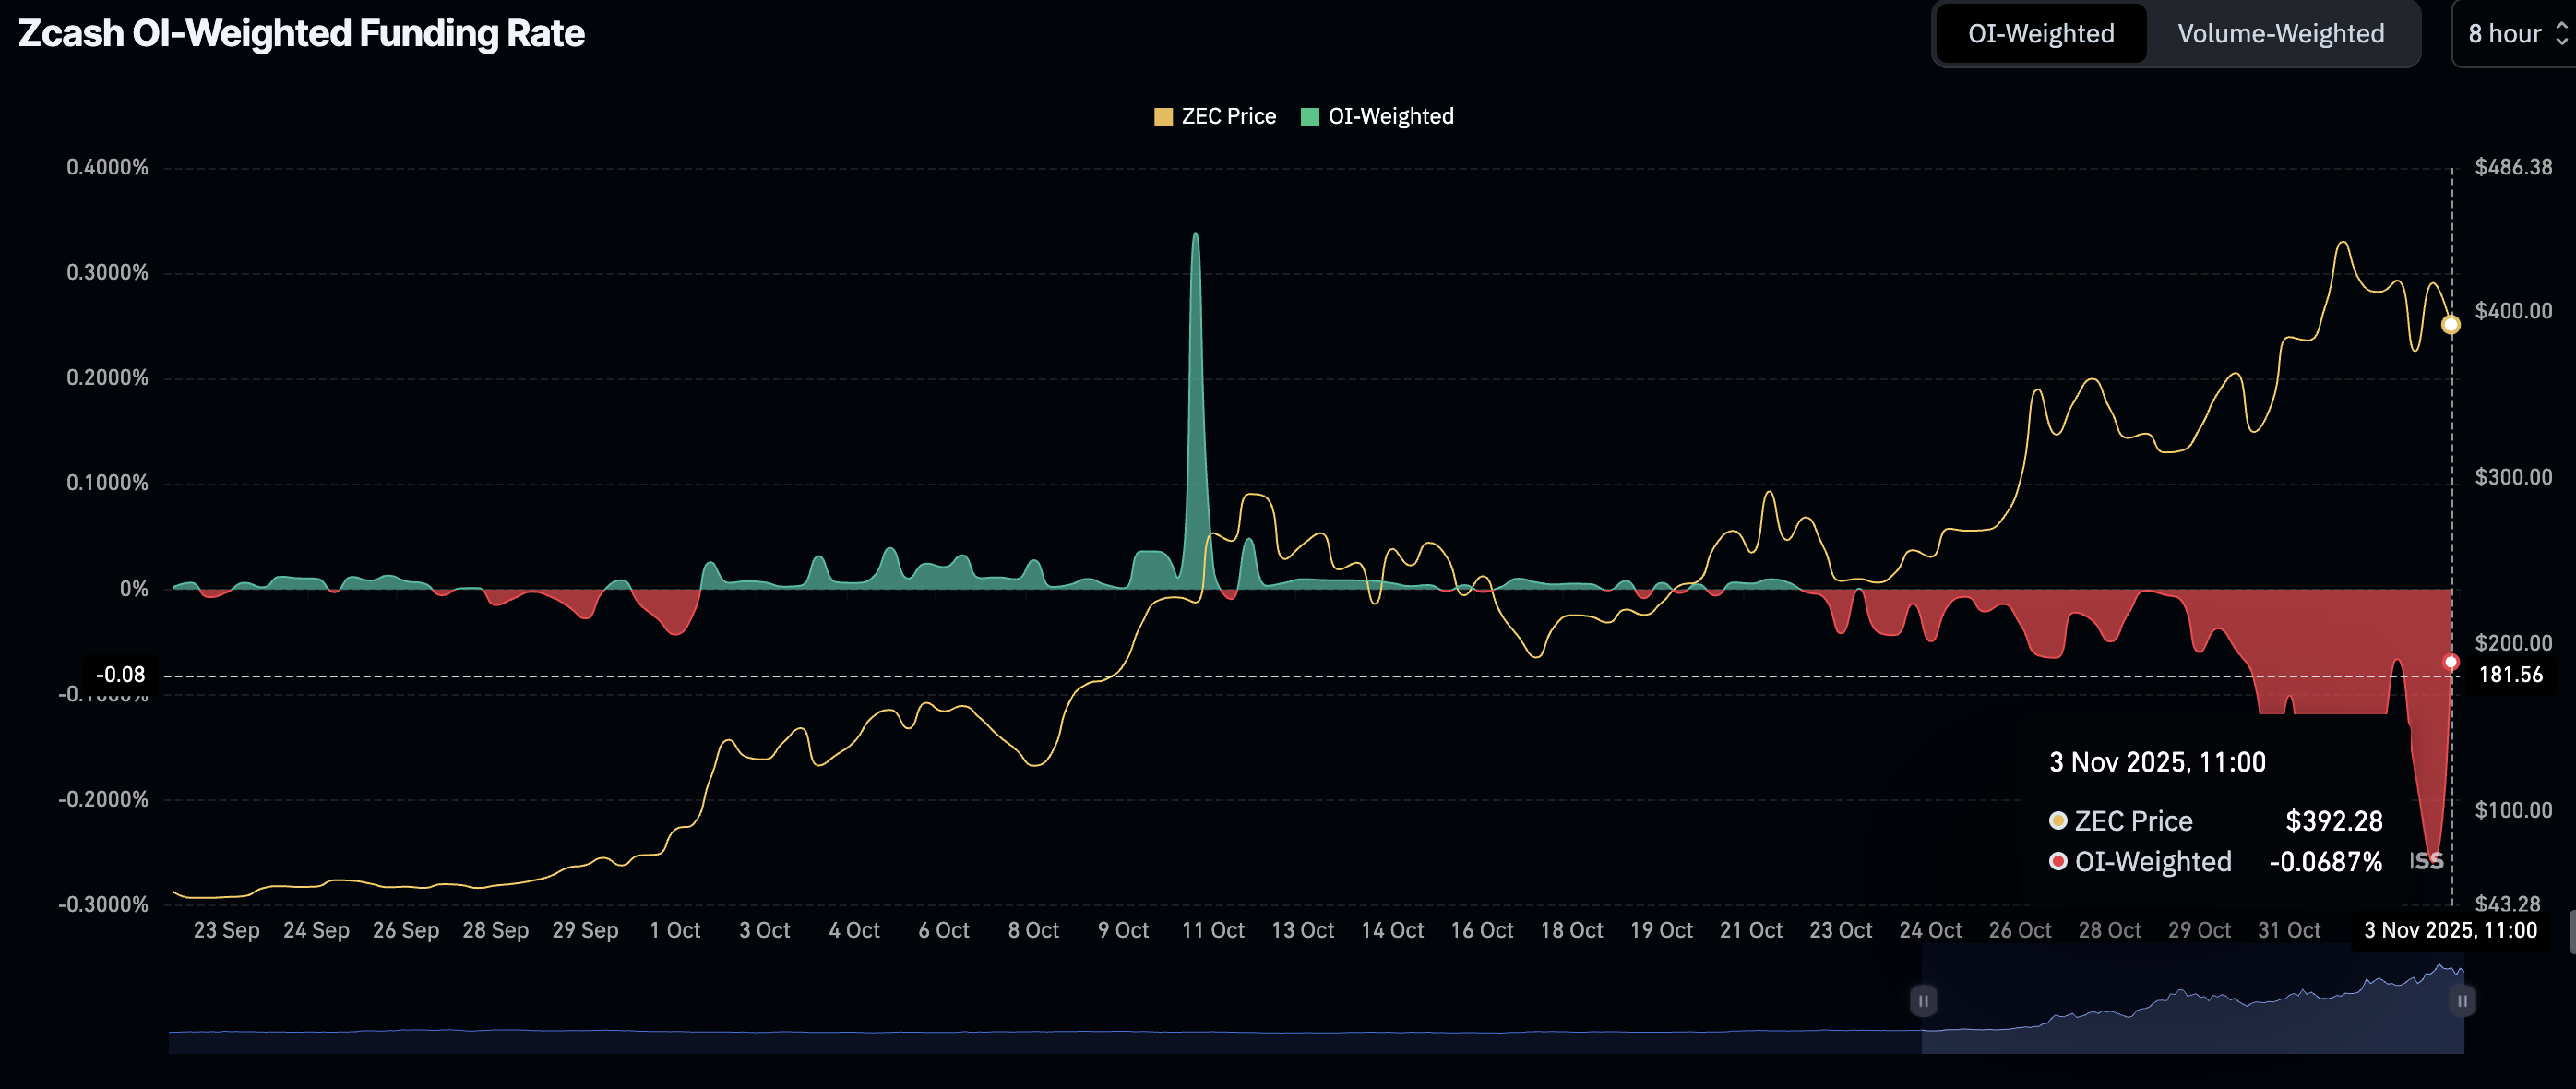
Zcash OI-Weighted Funding Rate | Source: CoinGlass
Technical outlook: Zcash eyes short-term support
Zcash is trading above its short-term support at $390 after trimming gains from the all-time high of $449, reached on Saturday. A sell signal from the Moving Average Convergence Divergence (MACD) indicator on the 4-hour chart since Sunday calls for investors to reduce their risk exposure, which adds to selling pressure.
The RSI is stable at 51 after declining from the overbought region on Saturday. This stability suggests that bearish and bullish forces are canceling each other out, with the winner of the tug-of-war likely to determine Zcash's short-term direction.
A daily close below $390 could push ZEC toward the 50-period Exponential Moving Average (EMA) at $363 on the same 4-hour chart.
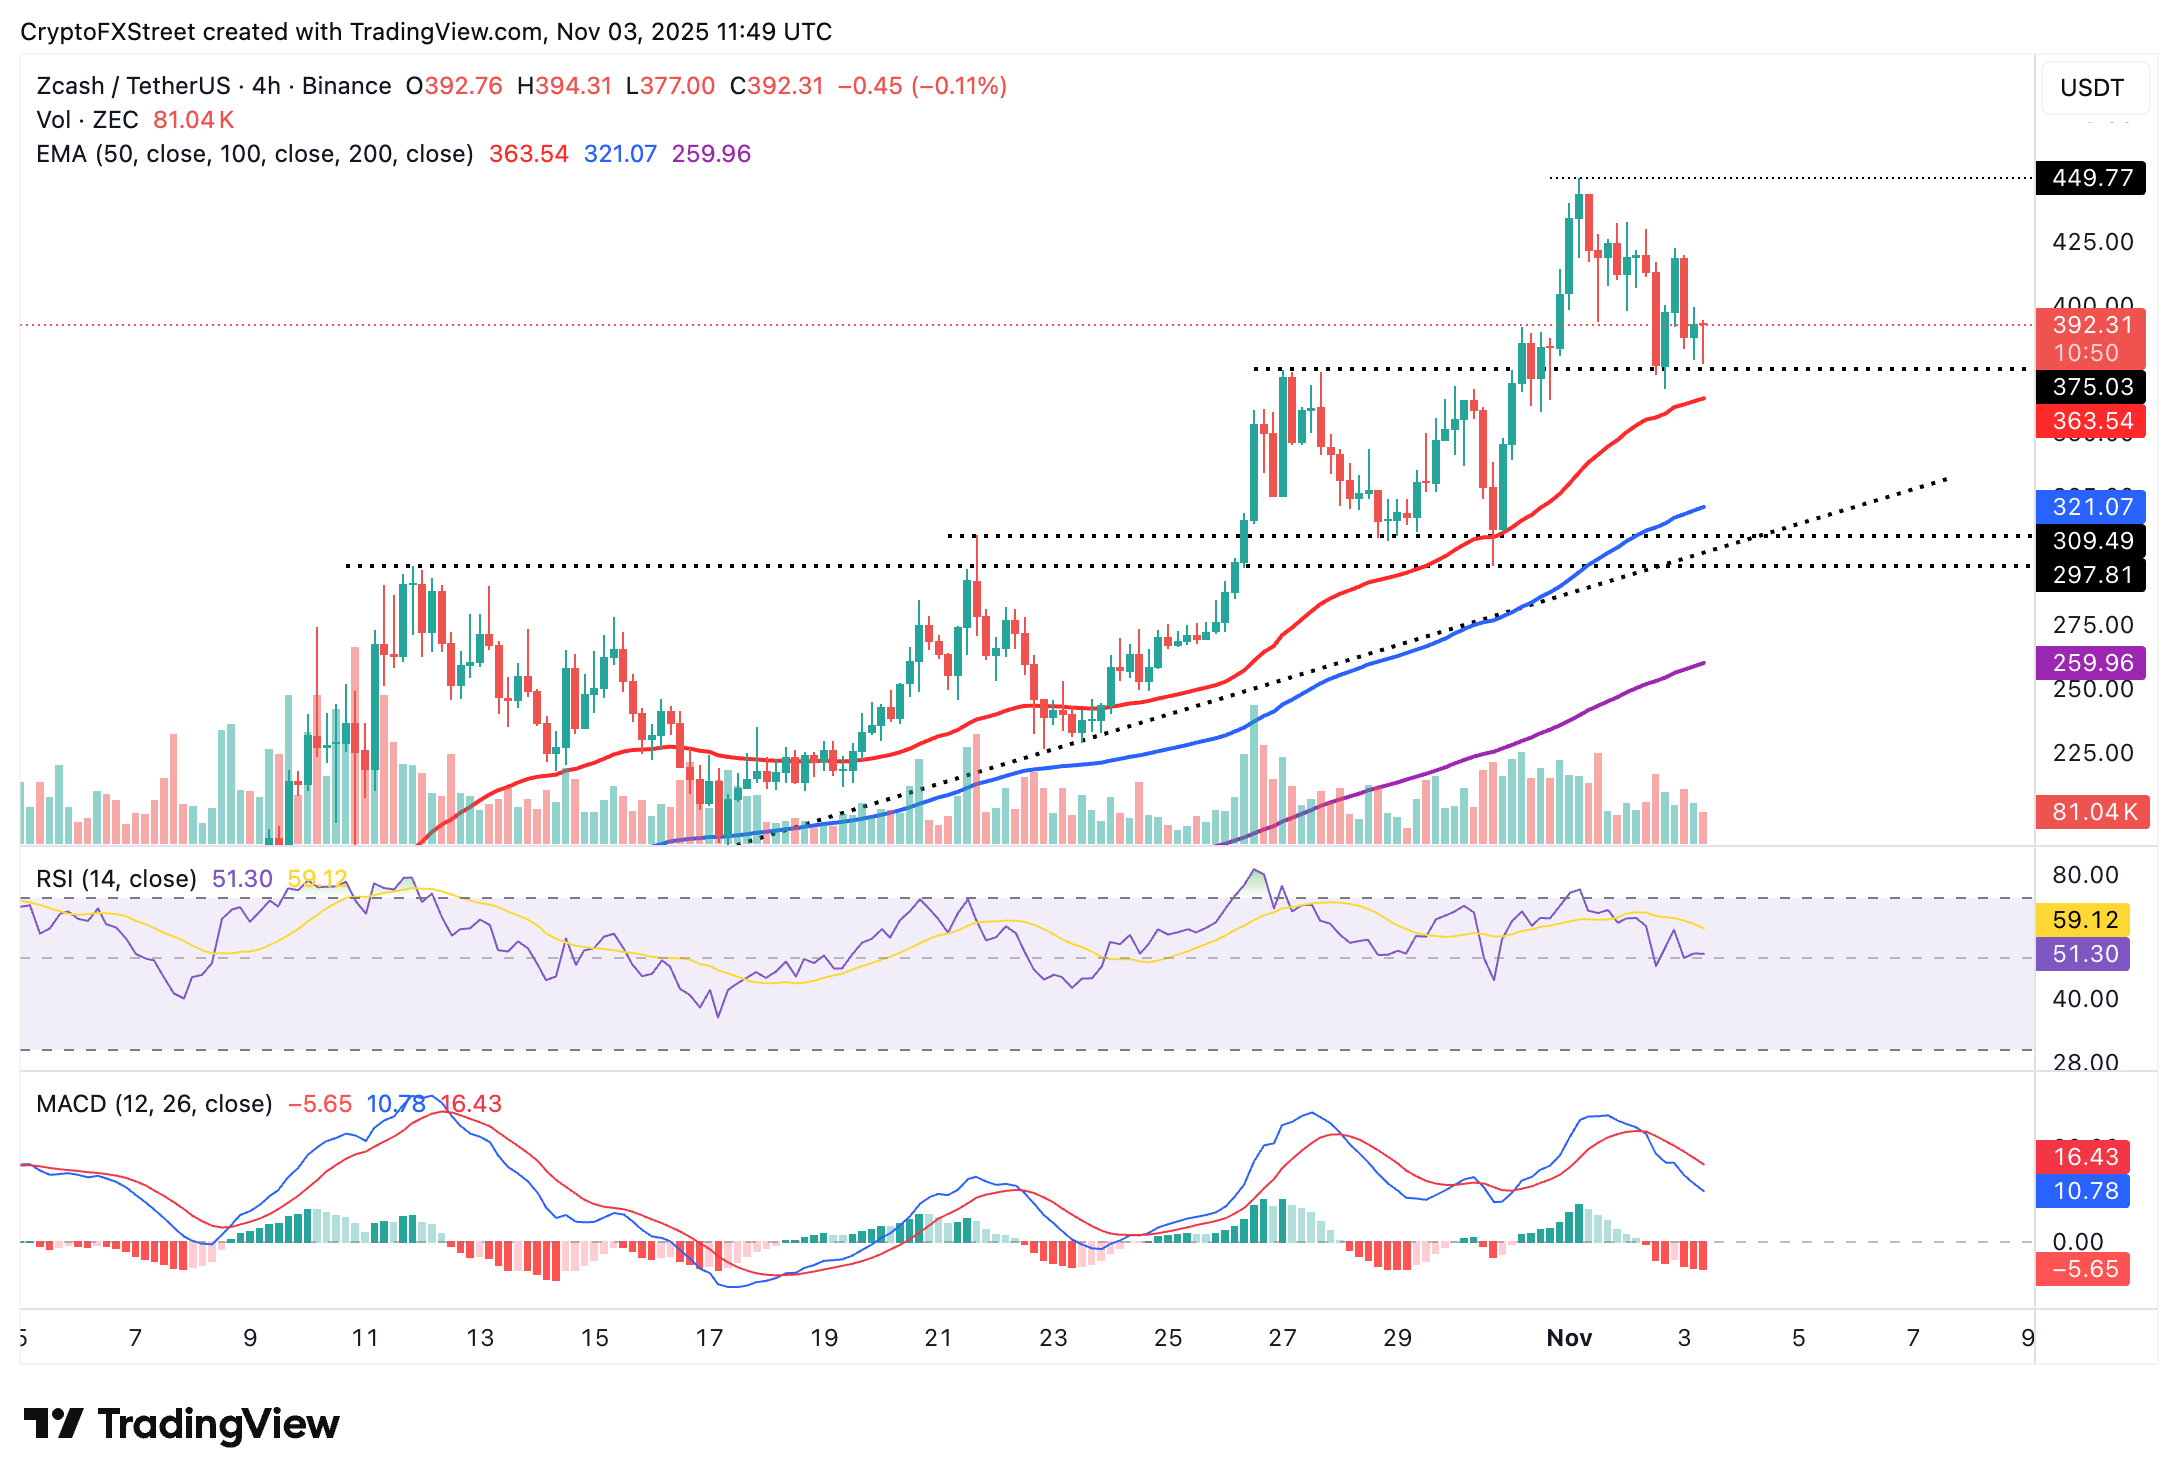
ZEC/USDT 4-hour chart
Still, Zcash may lift off to close the day above the round-number $400 resistance level if bulls seek new opportunities to buy the token after the correction from highs.
Cryptocurrency metrics FAQs
The developer or creator of each cryptocurrency decides on the total number of tokens that can be minted or issued. Only a certain number of these assets can be minted by mining, staking or other mechanisms. This is defined by the algorithm of the underlying blockchain technology. On the other hand, circulating supply can also be decreased via actions such as burning tokens, or mistakenly sending assets to addresses of other incompatible blockchains.
Market capitalization is the result of multiplying the circulating supply of a certain asset by the asset’s current market value.
Trading volume refers to the total number of tokens for a specific asset that has been transacted or exchanged between buyers and sellers within set trading hours, for example, 24 hours. It is used to gauge market sentiment, this metric combines all volumes on centralized exchanges and decentralized exchanges. Increasing trading volume often denotes the demand for a certain asset as more people are buying and selling the cryptocurrency.
Funding rates are a concept designed to encourage traders to take positions and ensure perpetual contract prices match spot markets. It defines a mechanism by exchanges to ensure that future prices and index prices periodic payments regularly converge. When the funding rate is positive, the price of the perpetual contract is higher than the mark price. This means traders who are bullish and have opened long positions pay traders who are in short positions. On the other hand, a negative funding rate means perpetual prices are below the mark price, and hence traders with short positions pay traders who have opened long positions.
Author

John Isige
FXStreet
John Isige is a seasoned cryptocurrency journalist and markets analyst committed to delivering high-quality, actionable insights tailored to traders, investors, and crypto enthusiasts. He enjoys deep dives into emerging Web3 tren


