ZAP Price Prediction: Upside potential on ZAP/USD as Chainlink’s alternative

Chances are you wouldn’t correctly guess this bull market’s top-performing token. It’s Zap Protocol (ZAP) -- a Chainlink (LINK) alternative that represents the most decentralized oracle proxy for smart contracts. Zap Protocol is a multifunctional blockchain solution offering full liquidity around many DeFi use-cases such as data monetization, token creation, and creating various decentralized applications (DApps). Innovatively, Zap’s smart contract templates use bonding curves, which are algorithmic market makers that provide the liquidity for the protocol. Zap Protocol went live on mainnet January 2019.
ZAP's 24-hour trading volume stands at $1,491,524 with a circulating supply of 236 million ZAP. with the remainder locked in time locked smart contracts having a total supply of $520 million. The top exchanges for trading in ZAP are currently Bitrue, HitBTC, ProBit Exchange, Poloniex, 0x Protocol, and Uniswap.
Chainlink has traded for as low as $0.1263 in September 2017, but now it has a recent price of circa $32, so the token has yielded returns of up to 25,668% to investors and hodlers over the last three years. This compares to ZAP’s one-year yield of 1,917%, with it trading at $0.01055 this time last February and currently trading at $0.21284. So Chainlink’s meteoric rise in price is very reminiscent of the upside potential ZAP currently enjoys.
ZAP might seem undervalued at this moment and given its multifunctionality and positive fundamentals, ZAP can reach parity with Chainlink in the very foreseeable future.
In comparison with Chainlink, Zap Protocol allows users to create decentralized oracles using smart contract templates, and to buy and sell the oracle tokens in an open fully-liquid marketplace. Many other tokenized products and services are offered on these fully-liquid decentralized markets such as to launch an ERC20 token, tokenize a piece of property, issue an NFT for a piece of art, create a decentralized futures market, or establishing decentralized autonomous organizations (DAOs).
While both Zap and Chainlink focus on bridging the gap between blockchain technology-based smart contracts and real-world applications, Zap Protocol takes the lead in creating a versatile and multi-functional platform more suitable for enterprise development.
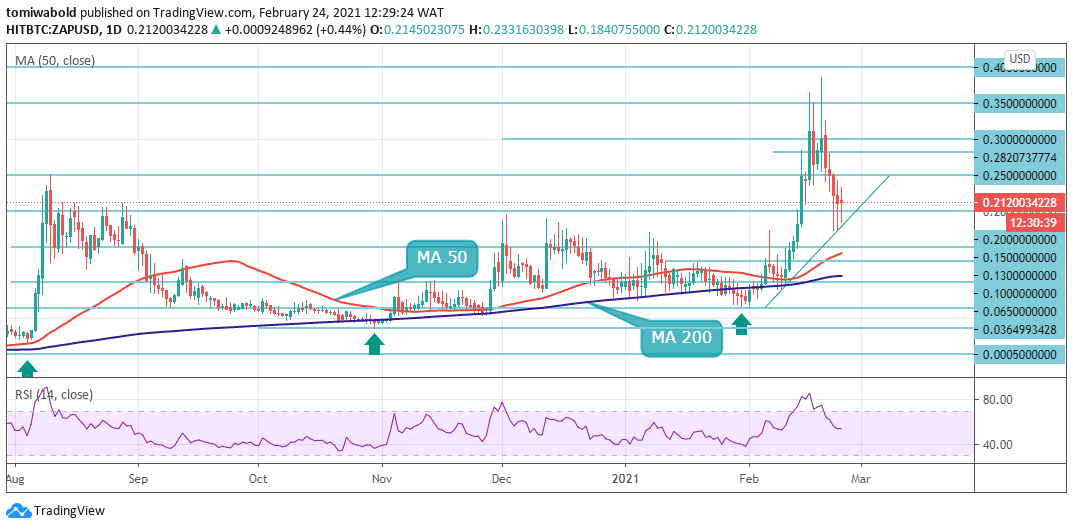
ZAP Price Analysis -Technicals for the ZAP/USD Pair Tilt Bullish
On the daily chart for the ZAP/USD market, the MA 50 historically led the pack in regards to the MA 200 since July 2020 following its cross higher and since then its price has traded above the MAs. The spot price also recently broke above the psychological $0.2 limiting zone where further consolidation is likely necessary before a retest of higher highs and beyond the yearly high and resistance at $0.3642.
Furthermore, buying positions have been on the increase since the end of the Jan 2021 price drop. Additionally, there is currently no active resistance to suggest a weakening of the bullish momentum. However, the RSI hit 86.50 on 16 Feb, the third-highest level on record.
Technicals for the ZAP/USD pair are tilting bullish although the RSI remains towards a correction lower, and its price is now above both the MA 50 and MA 200. Further long entry will trigger once ZAP/USD corrects lower as buyers may take advantage of such a dip. All eyes are on the heavy resistance zone between $0.2500 and $0.3000, yearly highs, and the psychological $0.35 level.
Despite the large pullback on 20 Feb from $0.3265 to $0.1745 low level on 23 Feb, the price did not make a lower low but did definitively end the miniature bearish pressure with a rebound. In the near term, the spot price will likely continue to range from $0.2000 to $0.3500, with a longer-term consolidation zone of $0.2000. Long entries are prudent once the price closes above both the MA 50 and MA 200.
The daily time frame shows that the ZAP/USD pair is trading inside and along an ascending trendline. The ZAP/USD pair is only bullish while trading above the $0.2000 level, and key resistance is found at the $0.2500 and the $0.3000 levels. If the ZAP/USD pair trades below the $0.2000, sellers may test the $0.1500 and $0.1000 support levels. The sentiment is turning positive again in the market and any further dip may trigger buy orders and give the bulls an opportunity to buy the dip.
Key Levels
Supply Levels: $0.3500, $0.3000, $0.2500
Demand Levels: $0.2000, $0.1500, $0.1000
Author

Mustapha Azeez
FX Instructor
I am a professional forex trader – signals strategist, funds manager, researcher and coach. I started my trading career some years back.


