Yearn.Finance Price Prediction: YFI showing signs of a bullish reversal
- YFI was down 72% since its peak at $43,966 but is showing signs of a reversal.
- The digital asset is currently trading at $18,439 after establishing a low at $12,260.

YFI is one of the most popular DeFi projects, overtaking Bitcoin in price, but not in market capitalization, which reached $1.2 billion at its peak.
Several indicators are showing YFI is ready for a bounce
On the daily chart, the bounce seems to be underway already after a low at $12,260.
YFI/USD daily chart
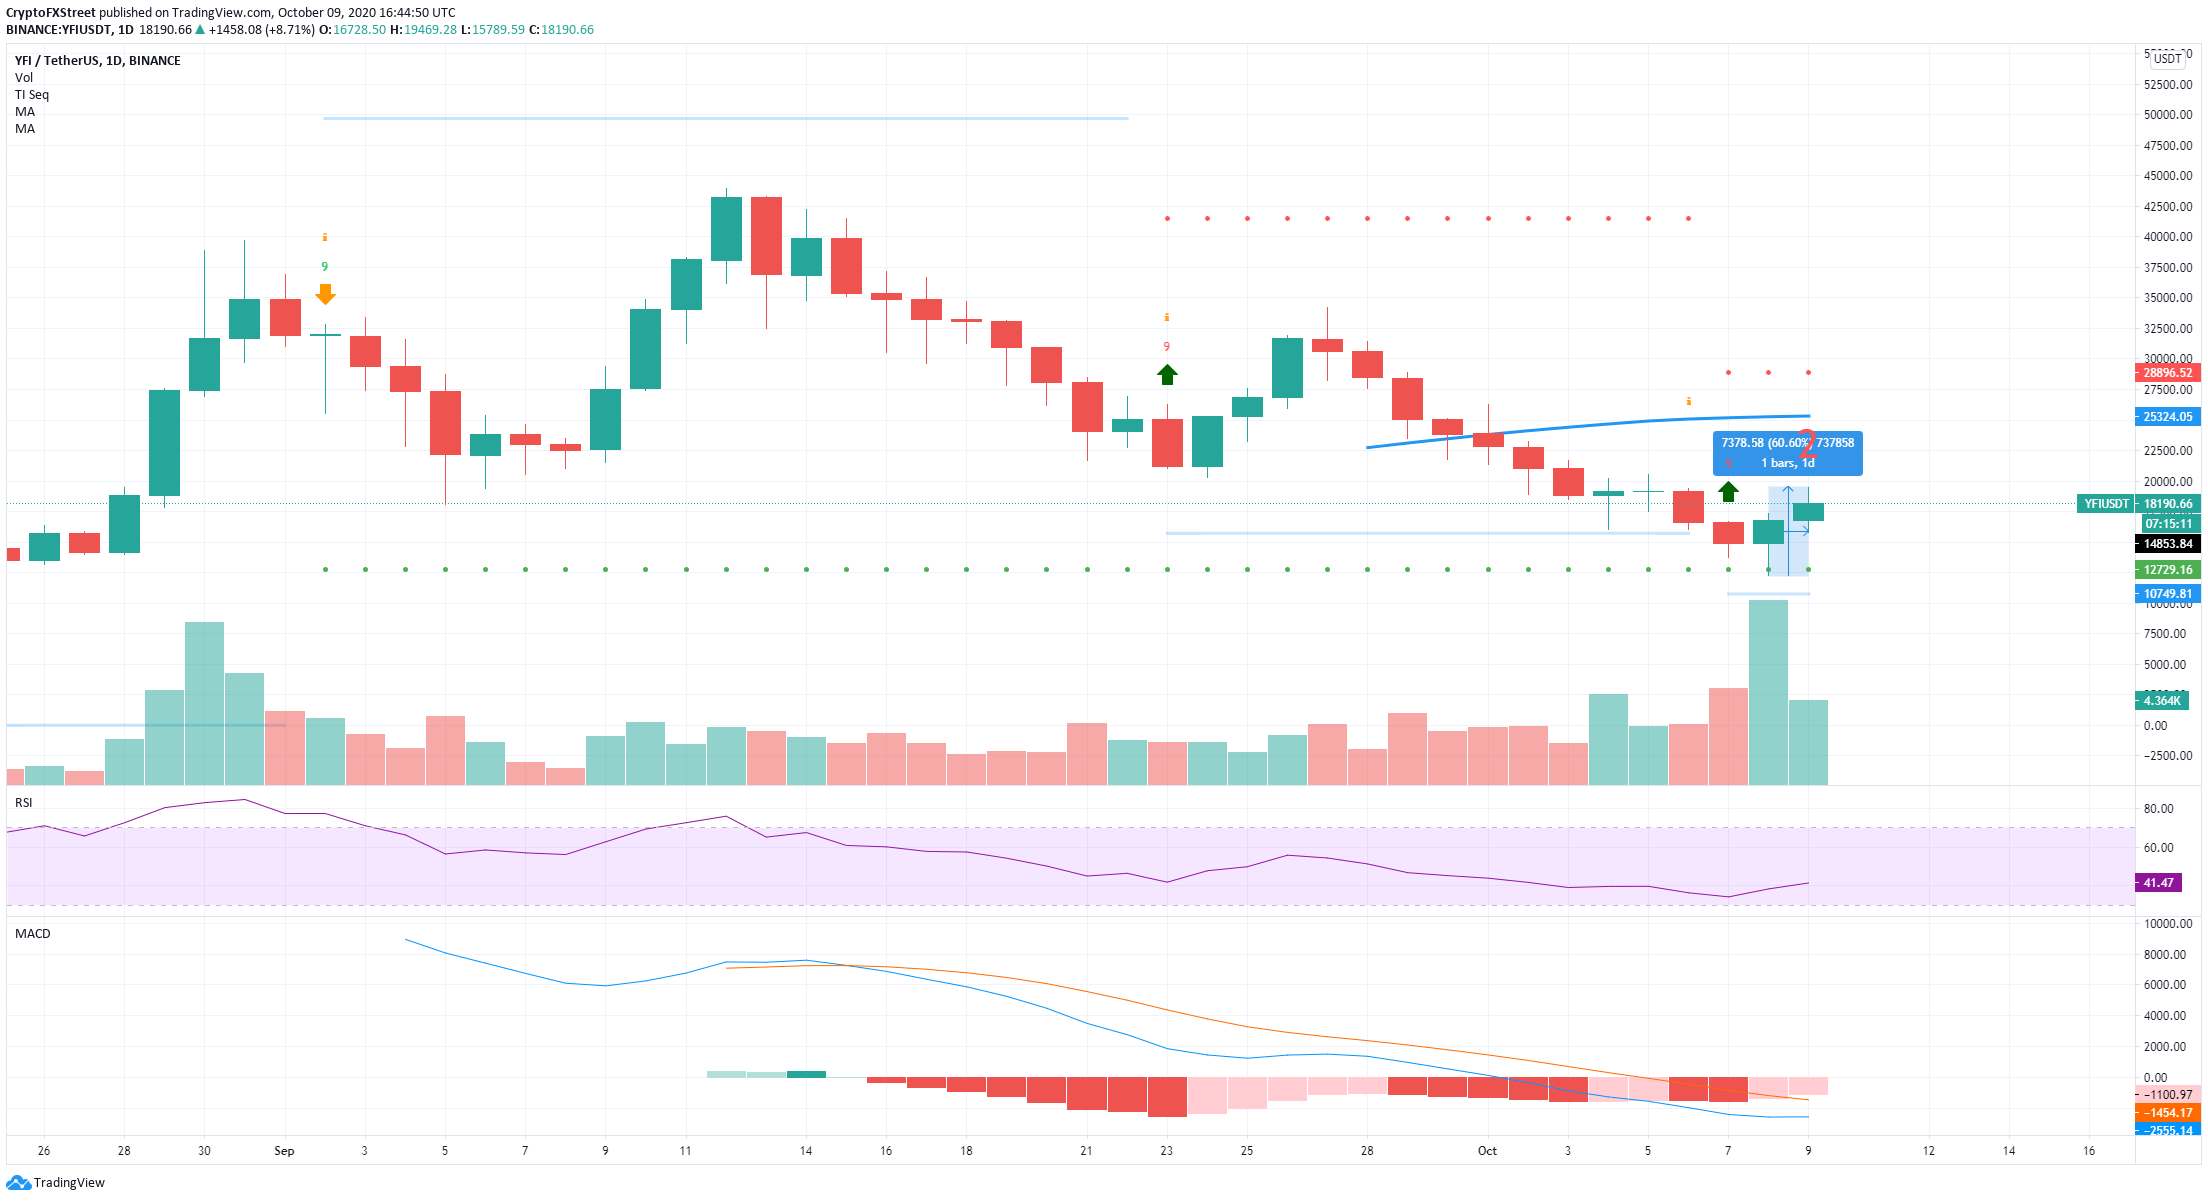
The TD sequential indicator presented a buy signal on October 7, which seems to have been validated over the next two days with a 60% bounce from YFI. The MACD is closer to a bullish cross, but not quite yet there.
YFI Open Interest Chart
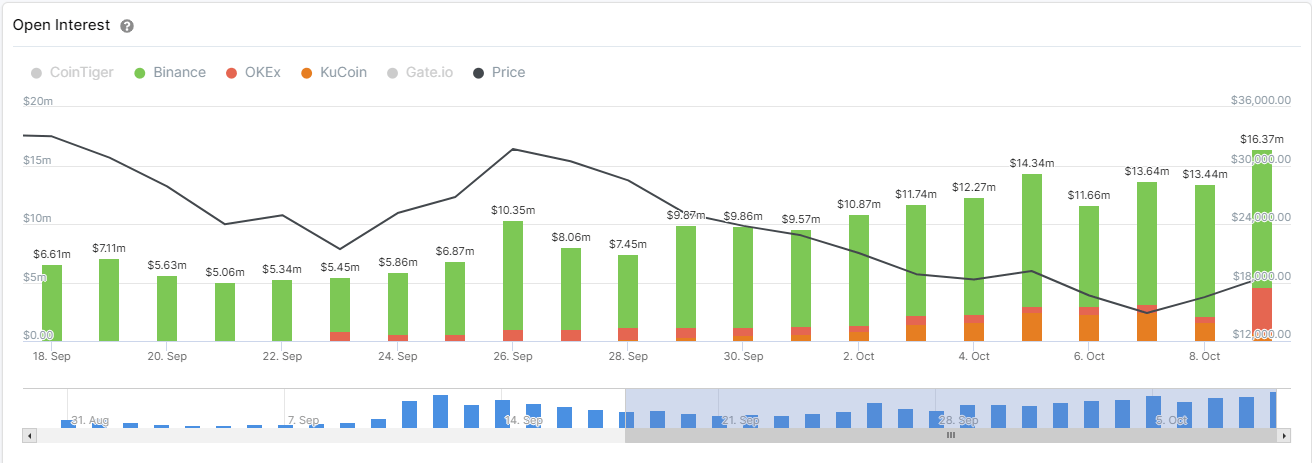
The average open interest of YFI on major exchanges like Binance, KuCoin, and OKEx, has increased significantly over the past 15 days. This metric represents the dollar amount of open positions and indicates that bulls are picking up steam.
YFI Number of Large Transactions
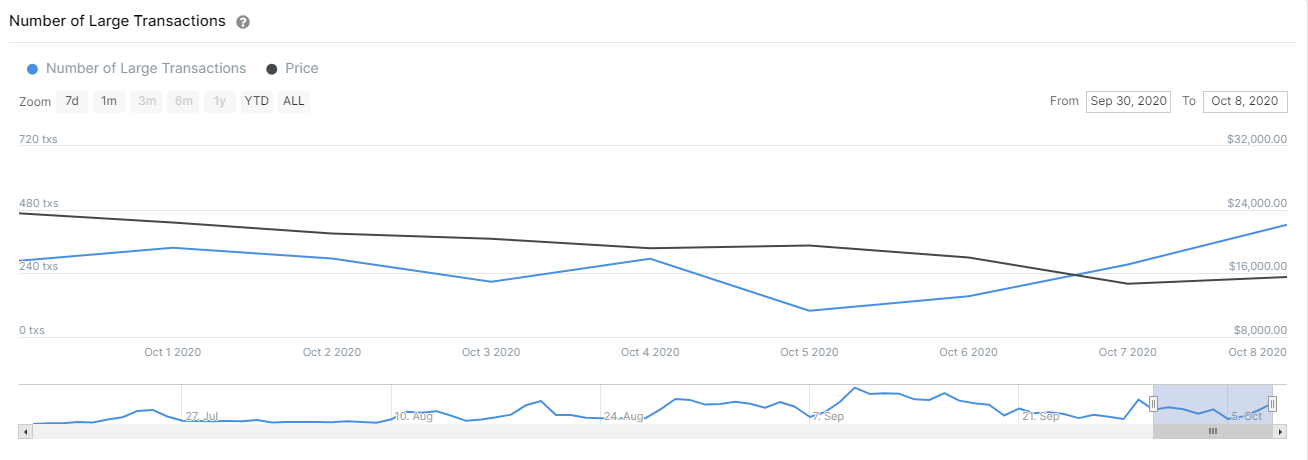
Using the chart provided by IntoTheBlock, we can observe a notable rise from a low of 99 transactions with a value of $100,000 or greater on October 5, to 423 transactions currently. Although an increase in large transactions doesn’t necessarily represent a bullish outlook, we can assume that most transactions were positive because of the rise in prices.
YFI/USD 1-hour chart
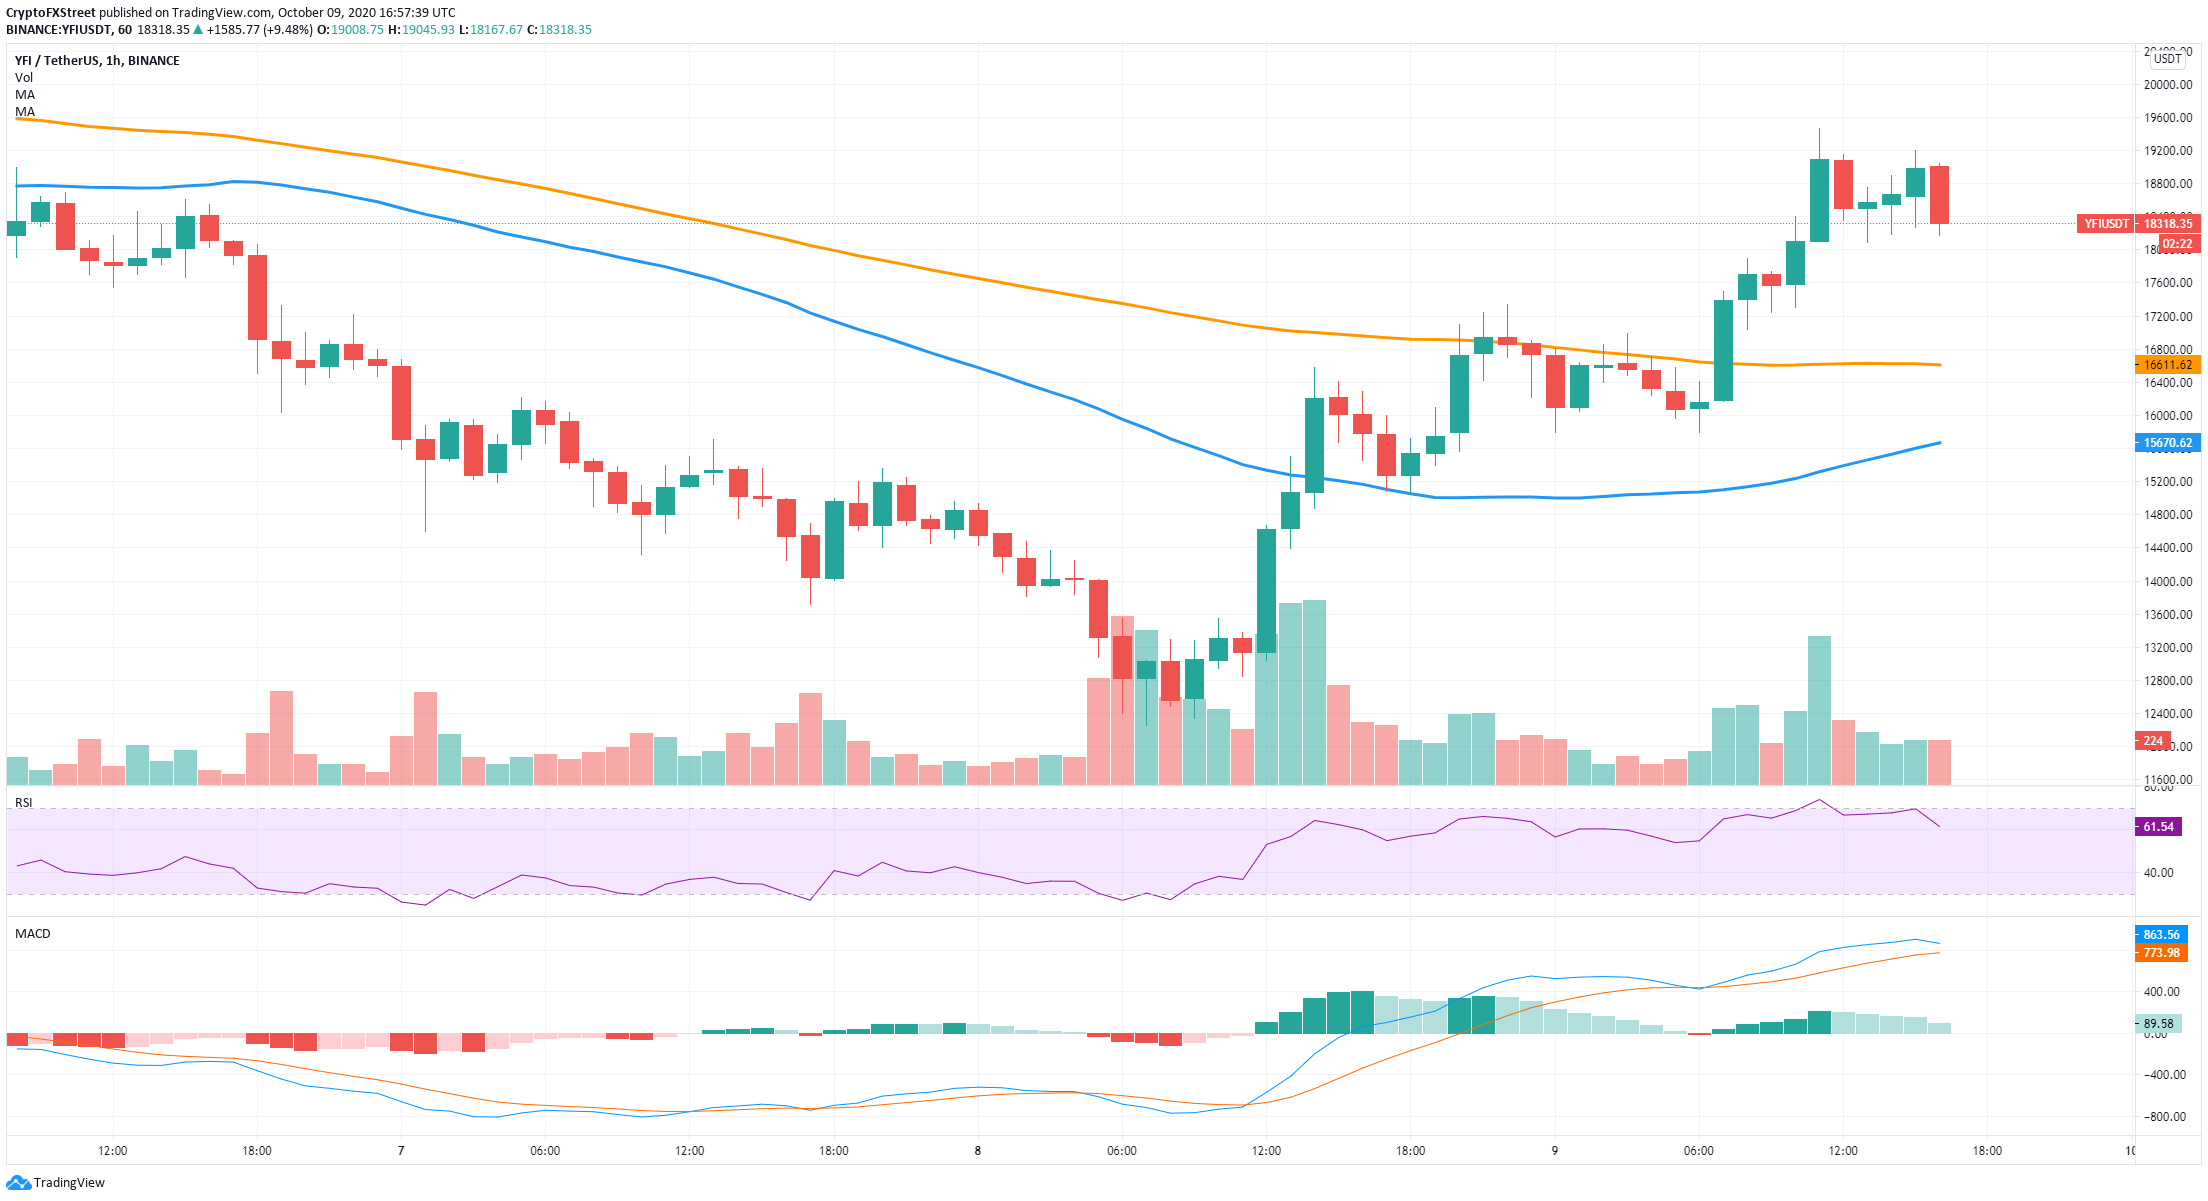
The hourly chart also flipped in favor of the bulls after climbing above the 50-SMA and then the 100-SMA and turning both into support levels. YFI has confirmed an hourly uptrend after establishing several higher highs and higher lows.
The next target price would be the psychological $20,000 level, followed by the 50-SMA on the daily chart at $25,000.
This rejection could slow down YFI bulls
However, looking at the 4-hour chart, we see that YFI is struggling to stay above the 50-SMA.
YFI/USD 4-hour chart
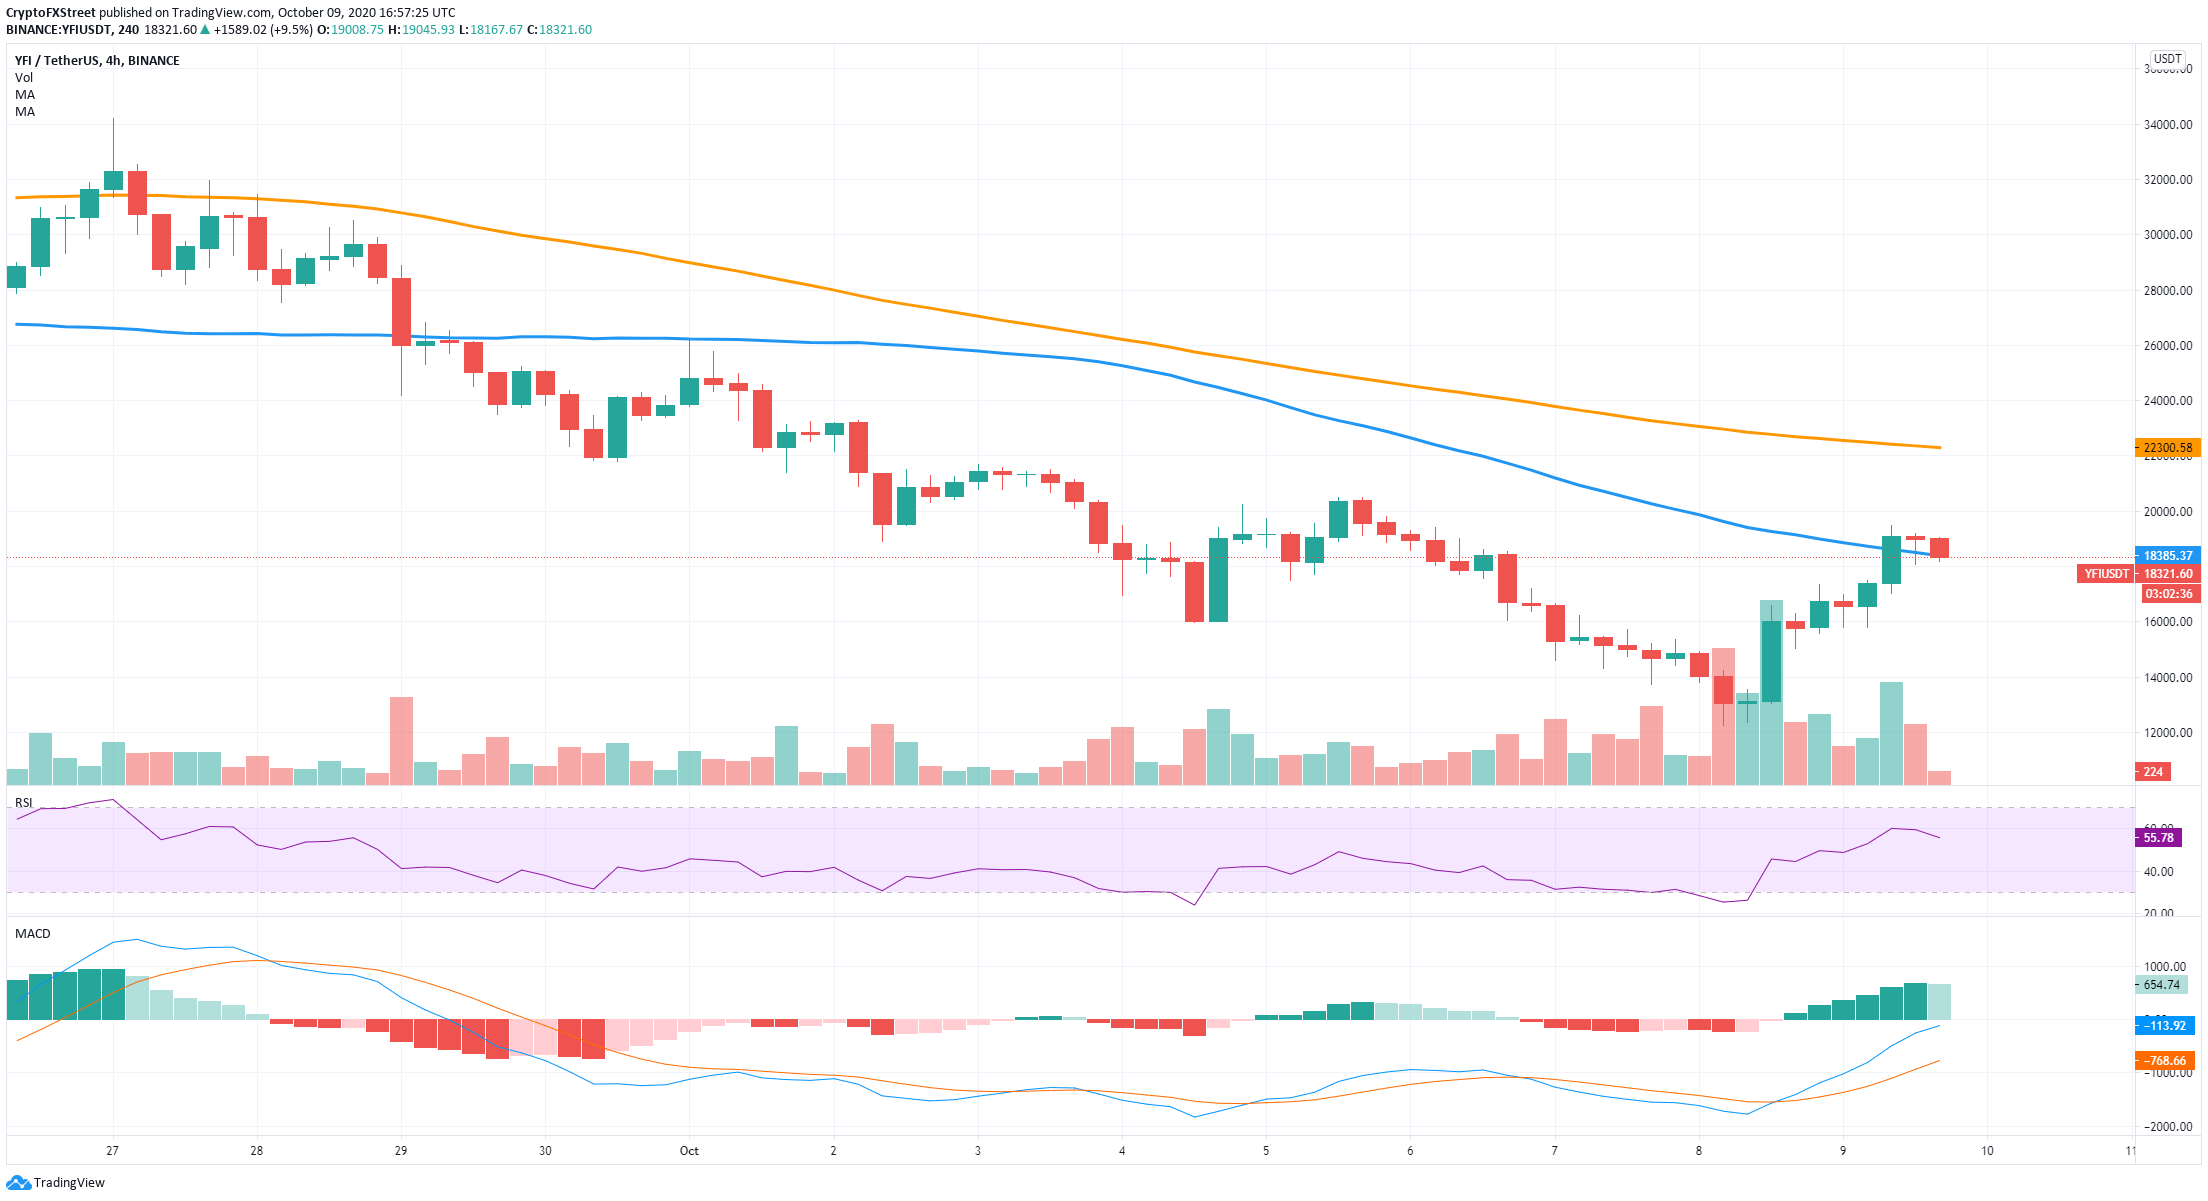
A rejection from $18,384 at the 50-SMA would be notable and likely to push YFI down, at least in the short-term.
YFI New Addresses
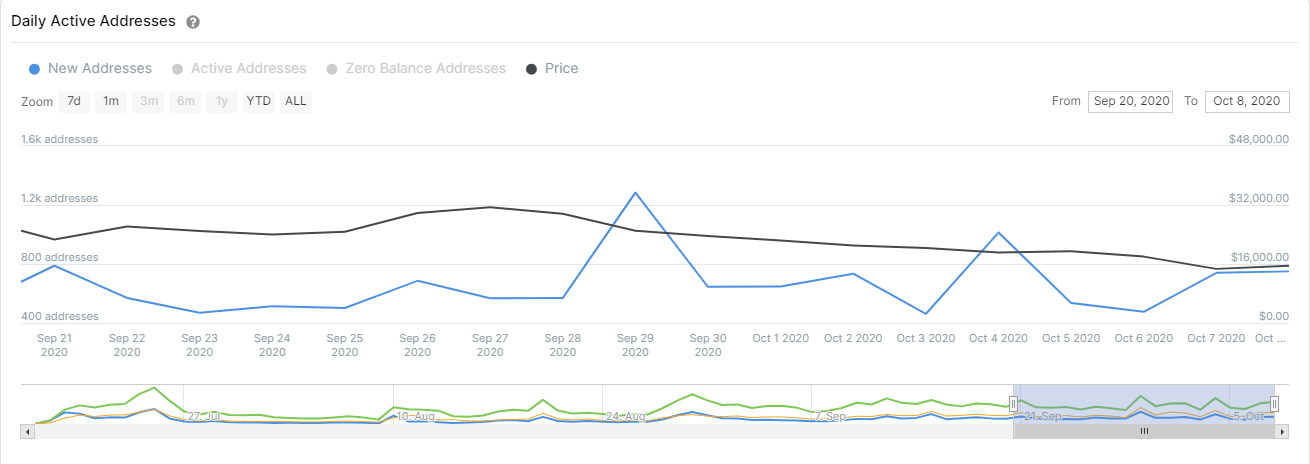
Furthermore, the number of new addresses joining the YFI network is not increasing. The peak of 1,280 on September 29 was followed by a lower high with 1,000 addresses on October 4 and only 750 currently.
This downtrend means that new investors are not particularly interested in YFI, even after the most recent bounce. The rejection of the 4-hour 50-SMA has the potential to push the digital asset down to $15,000.
Buyers need to look out for a clear breakout above the same level to eye up $20,000 and eventually $25,000, where the 50-SMA on the daily chart is established.
Author

Lorenzo Stroe
Independent Analyst
Lorenzo is an experienced Technical Analyst and Content Writer who has been working in the cryptocurrency industry since 2012. He also has a passion for trading.


