XRP price holds intraday gains as bulls advance toward $3.00
- XRP breaks out, holding intraday gains amid cooling spot volume and a steady increase in futures Open Interest.
- Investors may be preparing to take profits as exchange balances surge to 3.5 billion XRP.
- Supply in profit explodes, nearing May's peak of around 62 billion XRP, which signals a potential trend reversal in the short term.

Ripple (XRP) extends its recovery in tandem with major cryptocurrencies, trading above $2.80 on Friday. The prevailing technical structure reinforces XRP's bullish case and upholds the potential to rally above the critical psychological resistance at $3.00.
Meanwhile, on-chain data shows signs of a potential weakening of the uptrend as investors take profits or send XRP to exchanges in preparation for selling. Understanding the forces behind metrics like Exchange Balance and Total Supply in Profit could help provide a holistic view of the direction XRP is taking, particularly now when risk-on sentiment is increasing.
What's next for XRP as exchange balance, supply in profit expand
XRP has sustained the uptrend since the drop to the June low of $1.90, accruing nearly 50% in gains.
The steady price increase can be attributed to growing risk-on sentiment and a stronger derivatives market, as evidenced by the futures Open Interest's (OI) recovery to $5.9 billion, up from $3.5 billion on June 23.
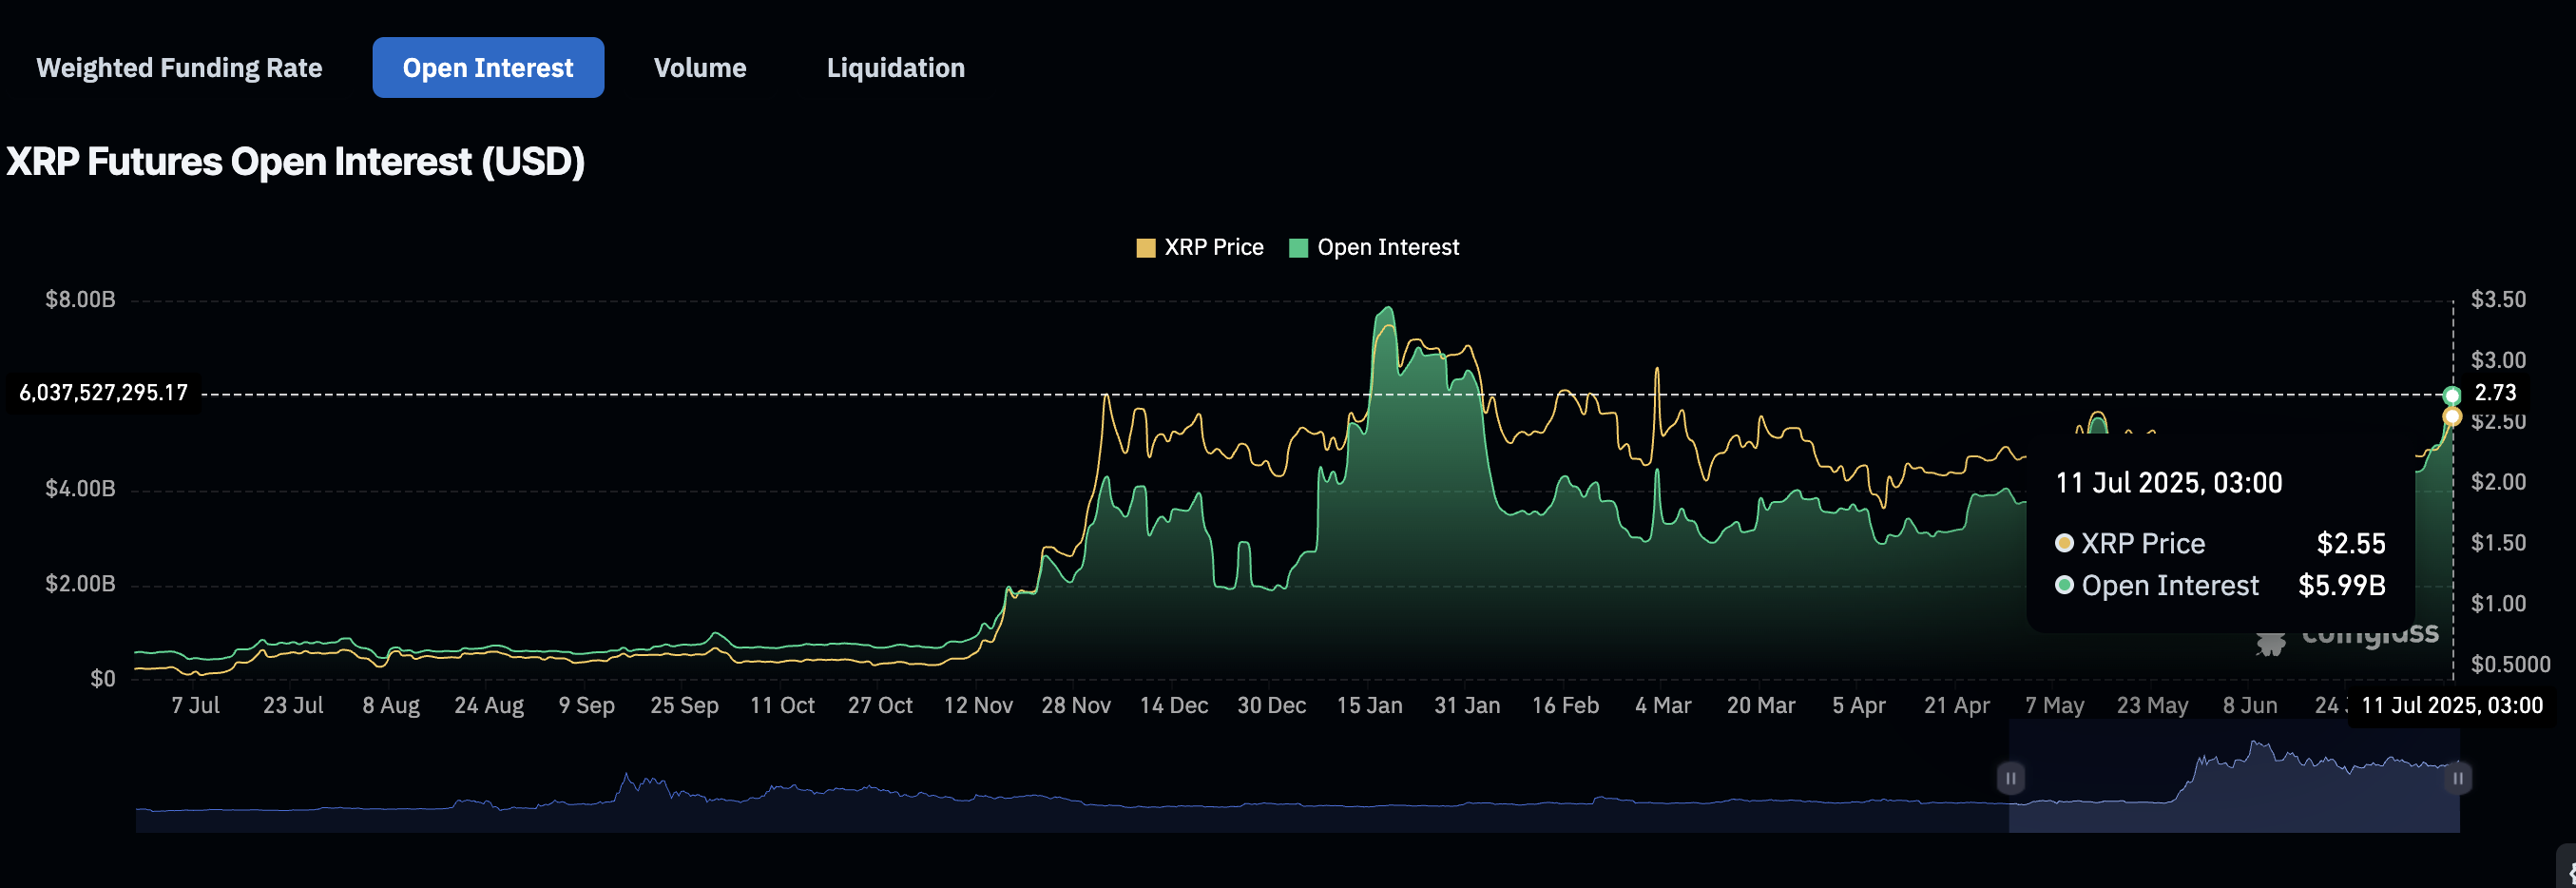
XRP futures Open Interest | Source: CoinGlass
CryptoQuant's Spot Volume Bubble Map shows that trading volume in the spot market is declining or cooling. Subdued activity in the spot market often indicates falling interest in XRP, which could hinder further price increases.
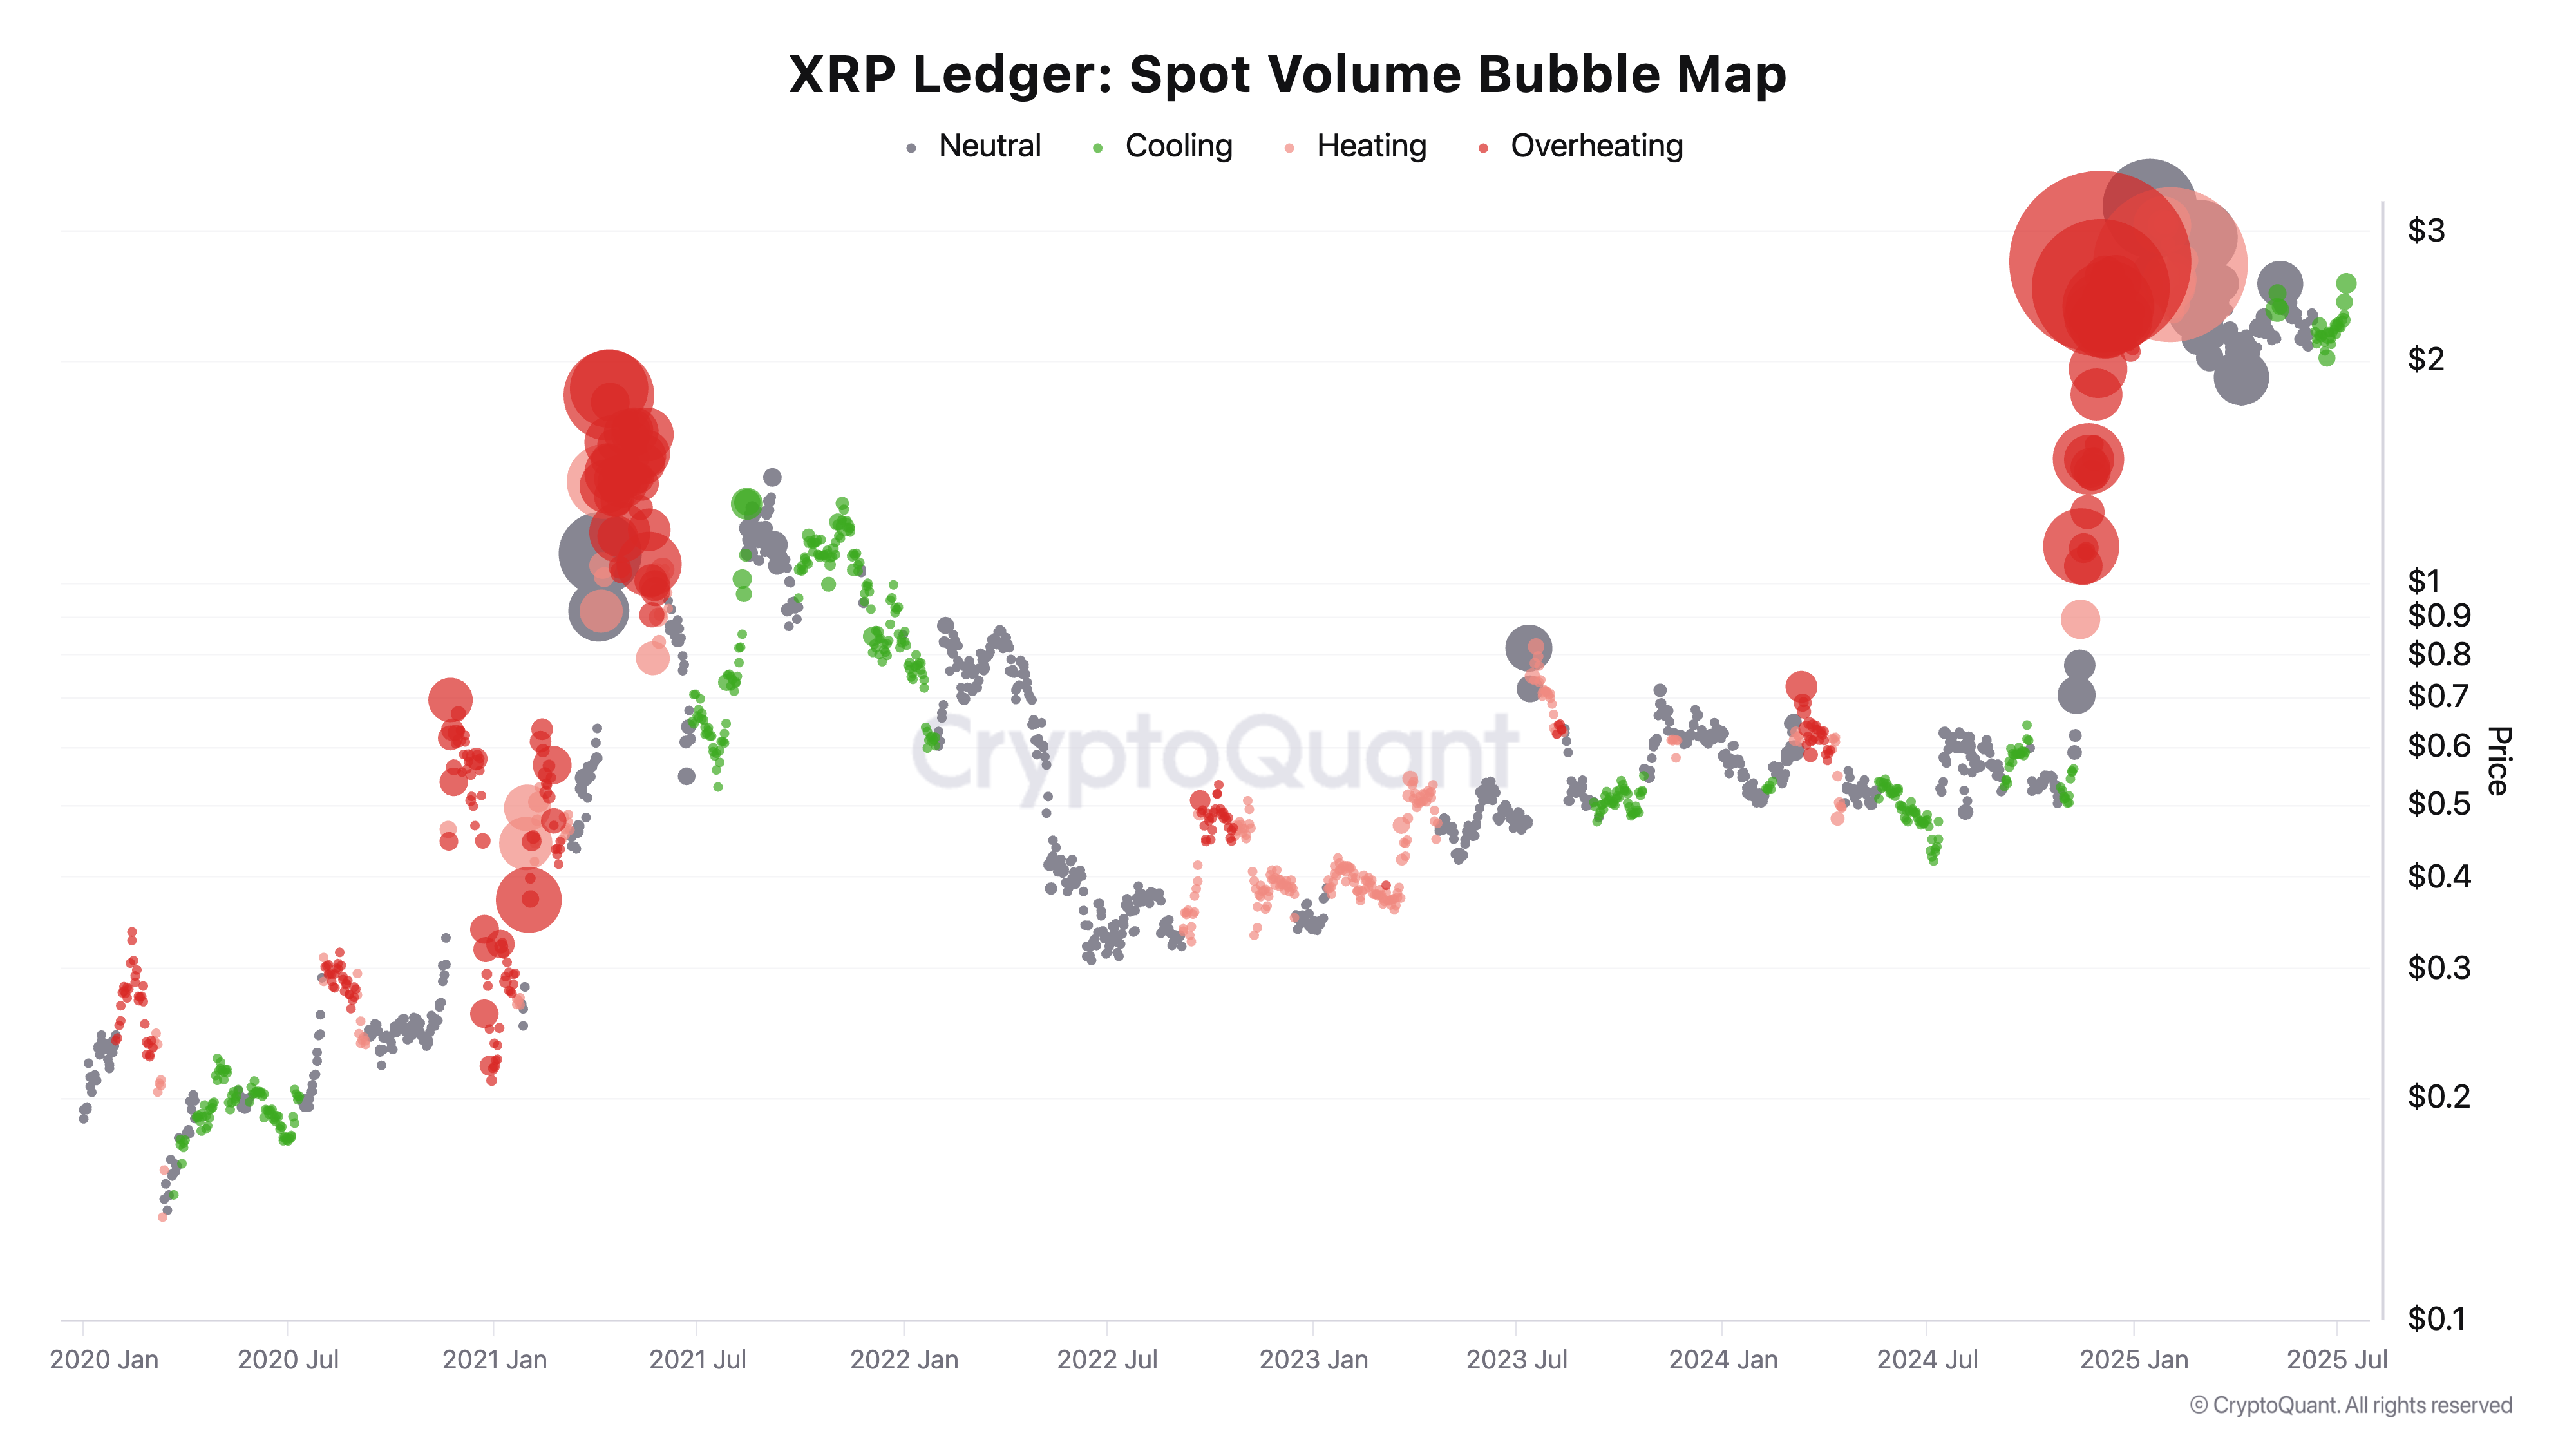
XRP Spot Volume Bubble Map | Source: CryptoQuant'
At the same time, investors are increasing transactions toward exchanges, with Glassnode's Total Exchange Balance metric rising by 2.9% to 3.5 billion XRP, as seen on June 23.
A surge in the exchange balance signals incoming selling pressure as holders prepare to sell or trade their XRP. If supply overshadows demand, this could result in a decline or price consolidation.
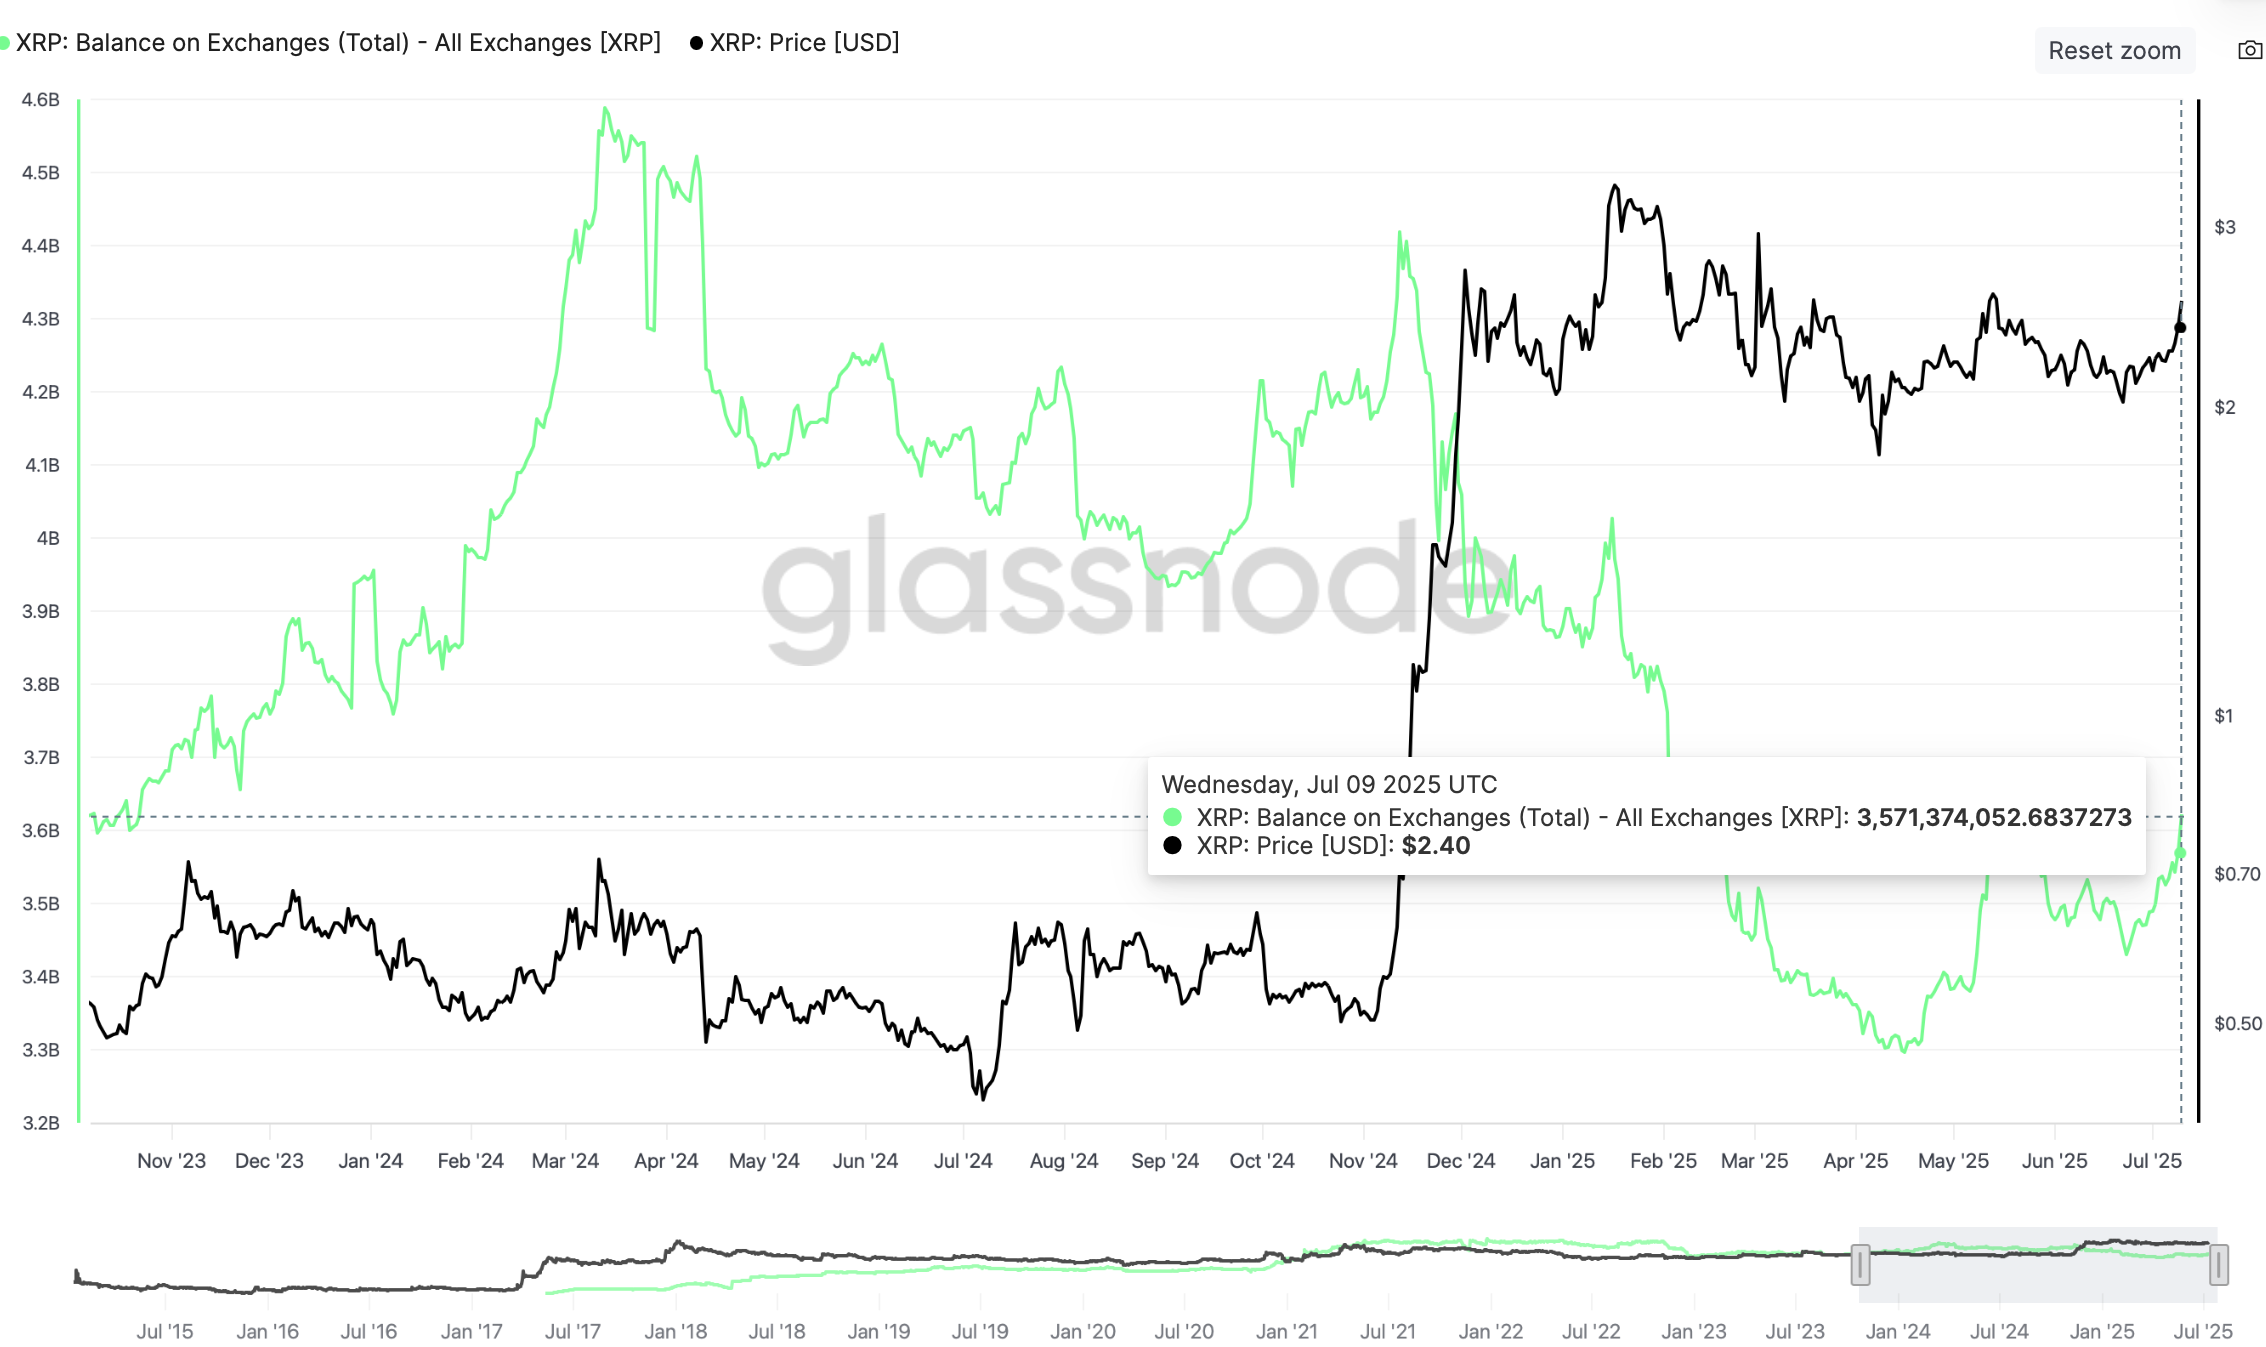
XRP Total Exchange Balance metric | Source: Glassnode
Additionally, a subsequent increase in the total supply, which creates a profit, predisposes XRP to overhead pressure, as holders are likely to sell to realize profit. The green line on the chart below represents the supply currently in profit at approximately 57.6 billion XRP.
A similar uptrend in May saw the supply in profit approach 62 billion XRP, but a sell-off followed, capping price action at $2.65 and extending the decline to $1.90 in June.
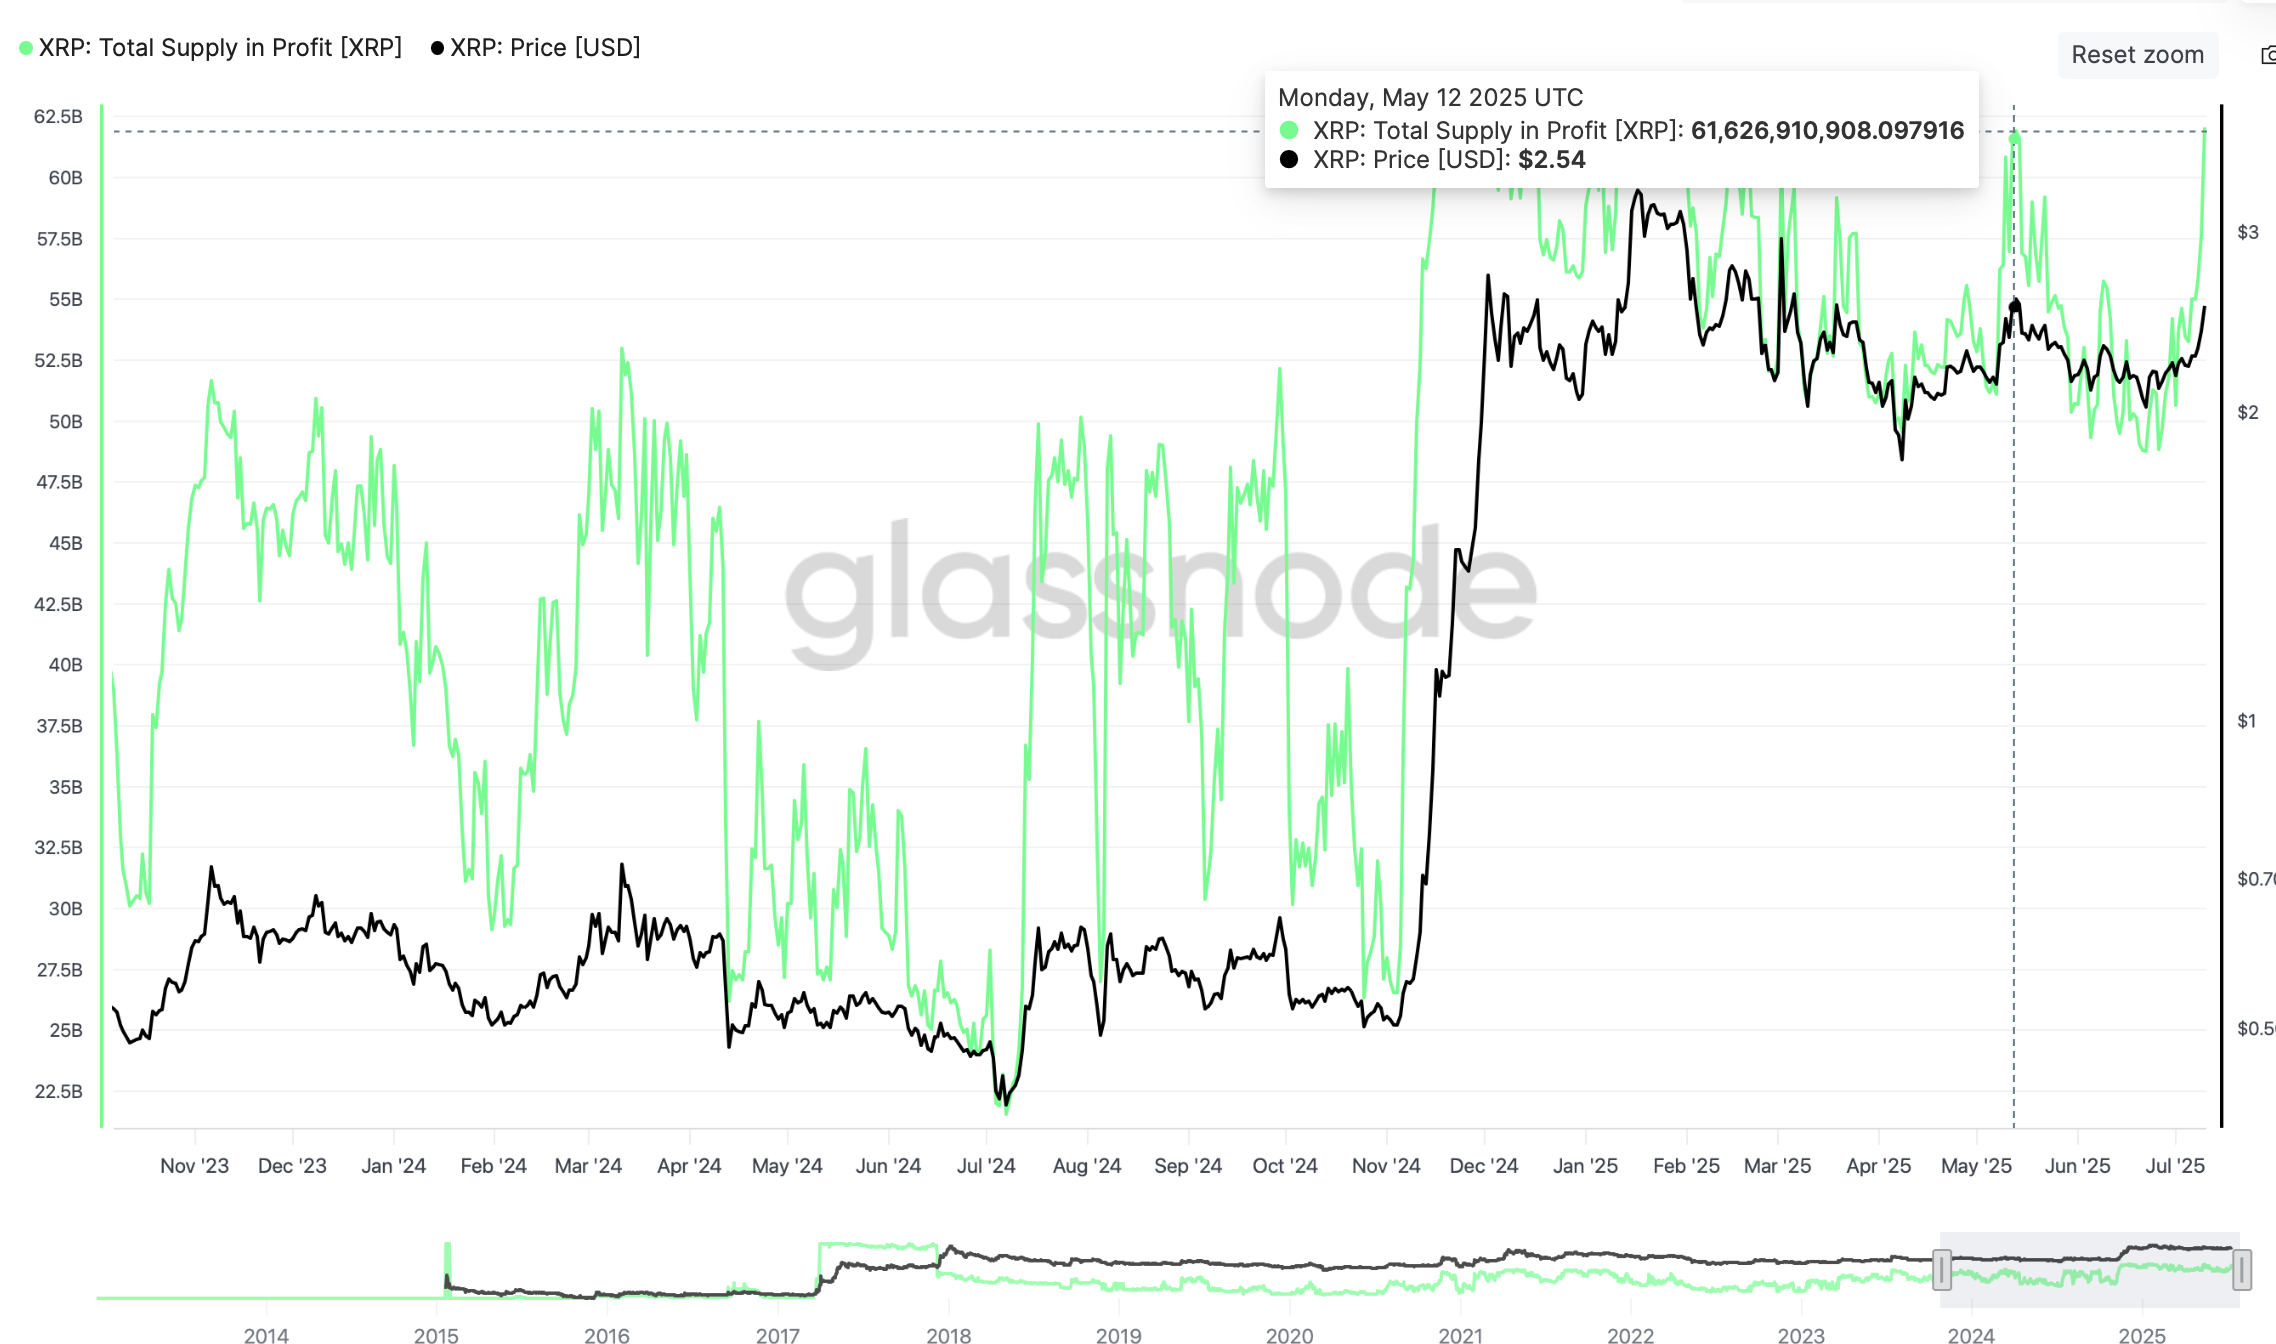
XRP Total Supply in Profit metric | Glassnode
Technical outlook: XRP completes technical pattern breakout
XRP price rally has surpassed $2.76, a target from an inverse Head-and-Shoulders (H&S) pattern, which was validated on Wednesday when bulls broke above the neckline resistance at $2.33.
The cross-border money remittance token is trading at $2.80 at the time of writing, buoyed by rising trading volume of $165 million. Similarly, the Money Flow Index (MFI), which tracks the amount of money entering or leaving XRP, backs this bullish outlook, holding at 89.
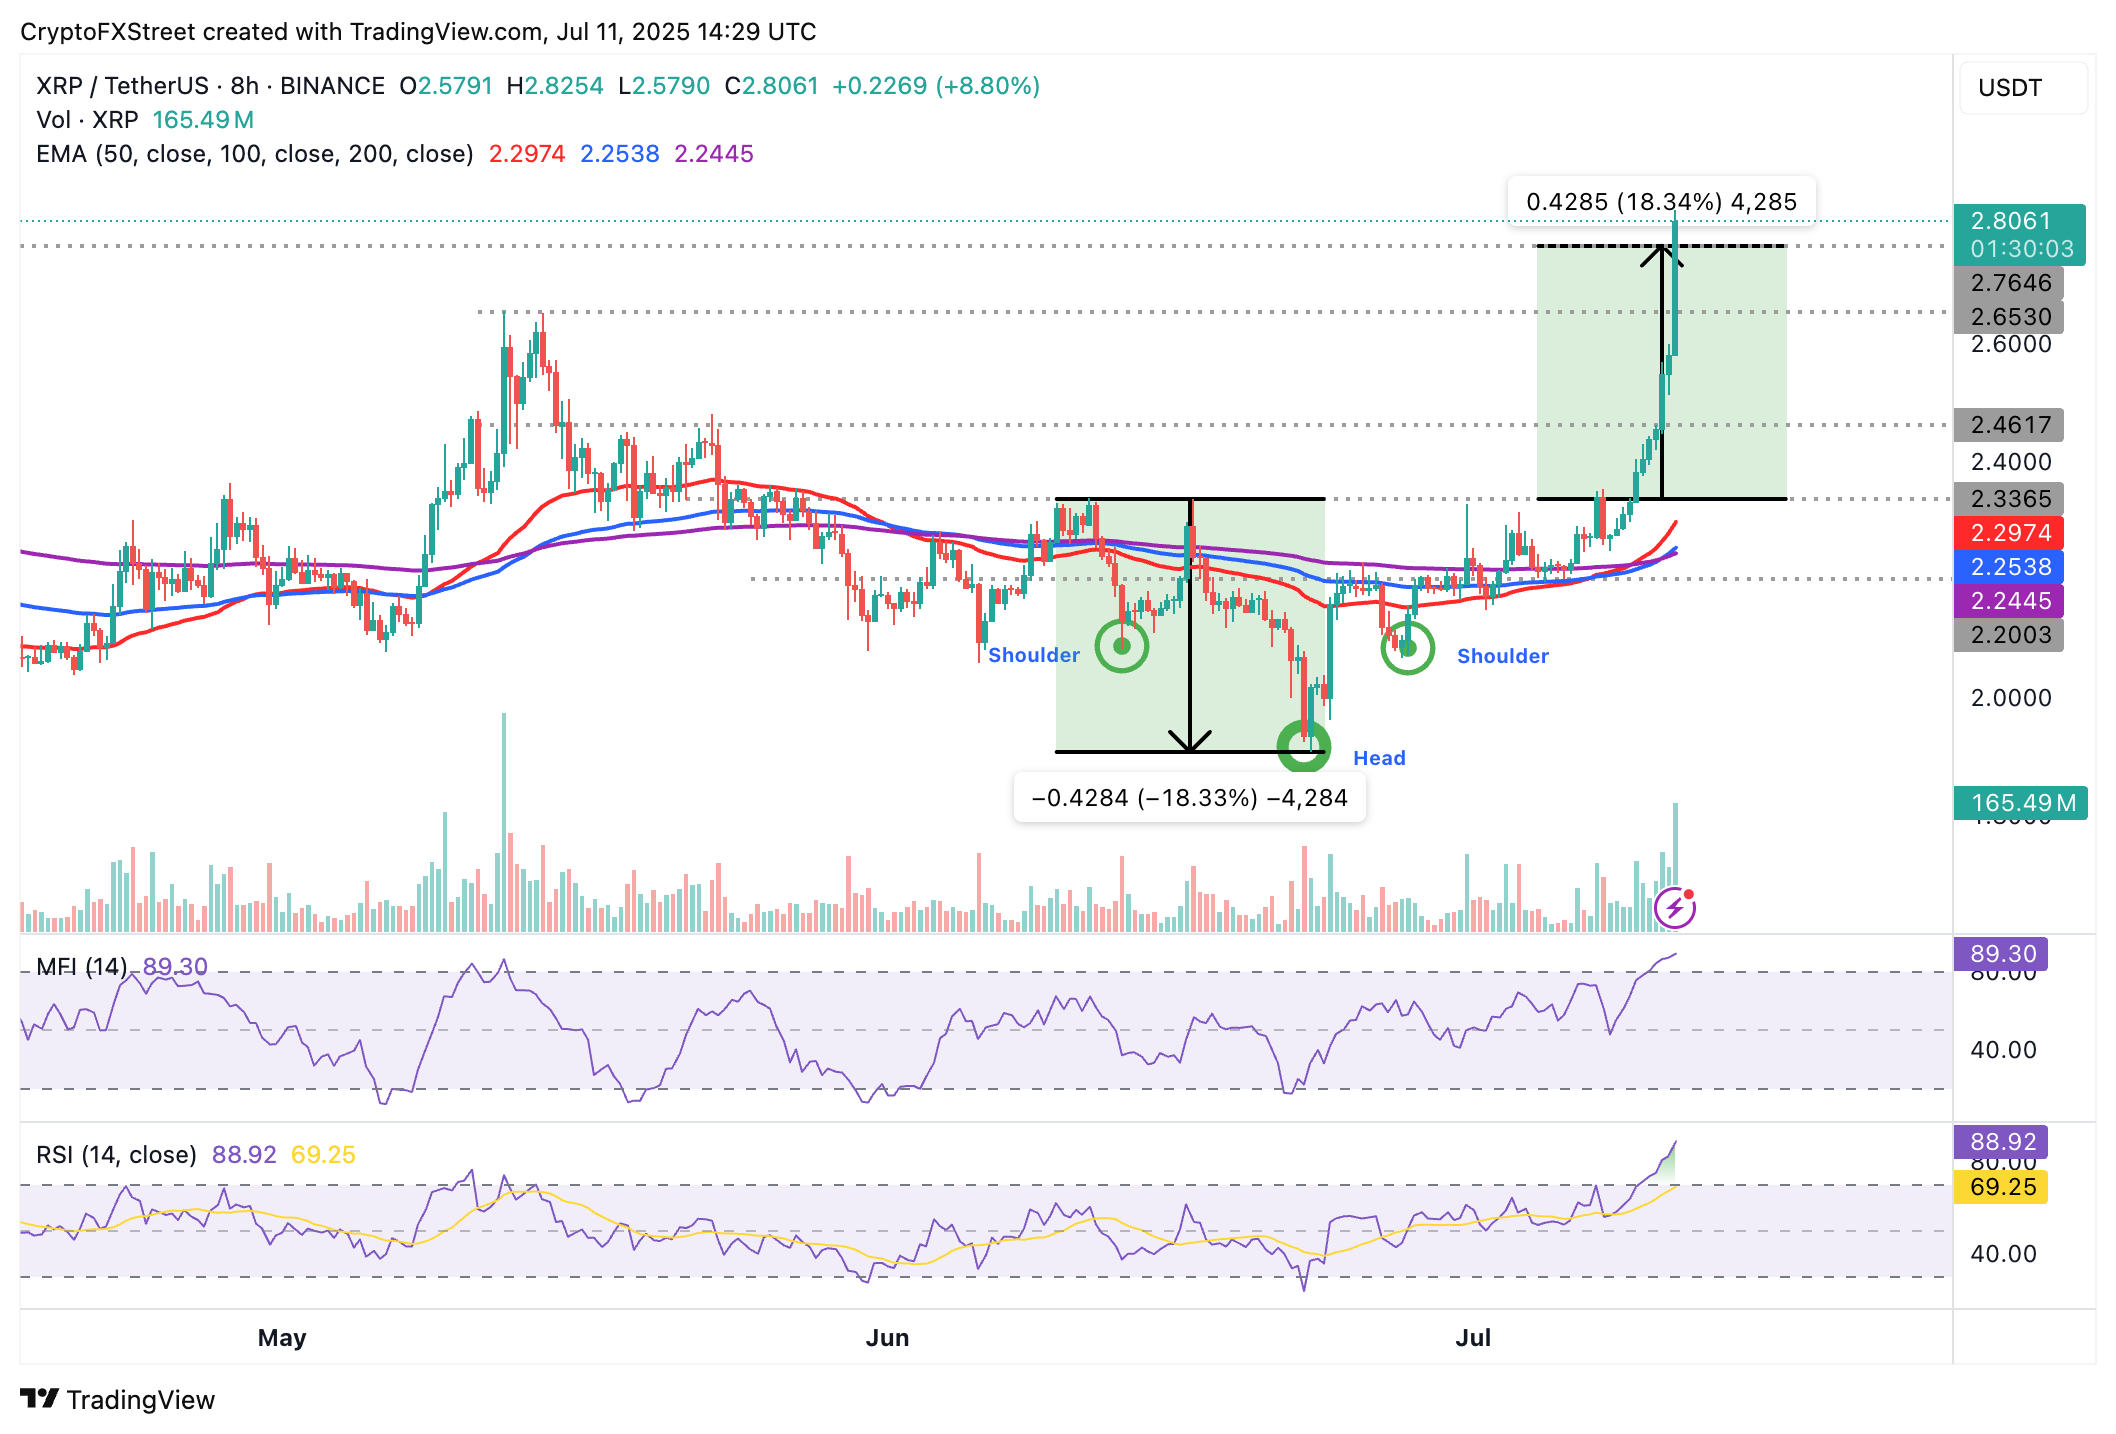
XRP/USDT daily chart
Still, the Relative Strength Index (RSI) overbought 88, suggesting that the rally could cool off before continuing toward $3.00. Hence, there is a need to tread carefully and prepare for a potential trend reversal. Profit-taking and risks highlighted by on-chain will likely be the main drives of the pullback.
Cryptocurrency metrics FAQs
The developer or creator of each cryptocurrency decides on the total number of tokens that can be minted or issued. Only a certain number of these assets can be minted by mining, staking or other mechanisms. This is defined by the algorithm of the underlying blockchain technology. On the other hand, circulating supply can also be decreased via actions such as burning tokens, or mistakenly sending assets to addresses of other incompatible blockchains.
Market capitalization is the result of multiplying the circulating supply of a certain asset by the asset’s current market value.
Trading volume refers to the total number of tokens for a specific asset that has been transacted or exchanged between buyers and sellers within set trading hours, for example, 24 hours. It is used to gauge market sentiment, this metric combines all volumes on centralized exchanges and decentralized exchanges. Increasing trading volume often denotes the demand for a certain asset as more people are buying and selling the cryptocurrency.
Funding rates are a concept designed to encourage traders to take positions and ensure perpetual contract prices match spot markets. It defines a mechanism by exchanges to ensure that future prices and index prices periodic payments regularly converge. When the funding rate is positive, the price of the perpetual contract is higher than the mark price. This means traders who are bullish and have opened long positions pay traders who are in short positions. On the other hand, a negative funding rate means perpetual prices are below the mark price, and hence traders with short positions pay traders who have opened long positions.
Author

John Isige
FXStreet
John Isige is a seasoned cryptocurrency journalist and markets analyst committed to delivering high-quality, actionable insights tailored to traders, investors, and crypto enthusiasts. He enjoys deep dives into emerging Web3 tren


