XRP/USD technical analysis: Ripple fell by more than 8% during this week

Since the beginning of the week, the price of Ripple fell by 8.29% decreasing from $0.37237 to the current levels of $0.34160 on FXOpen.
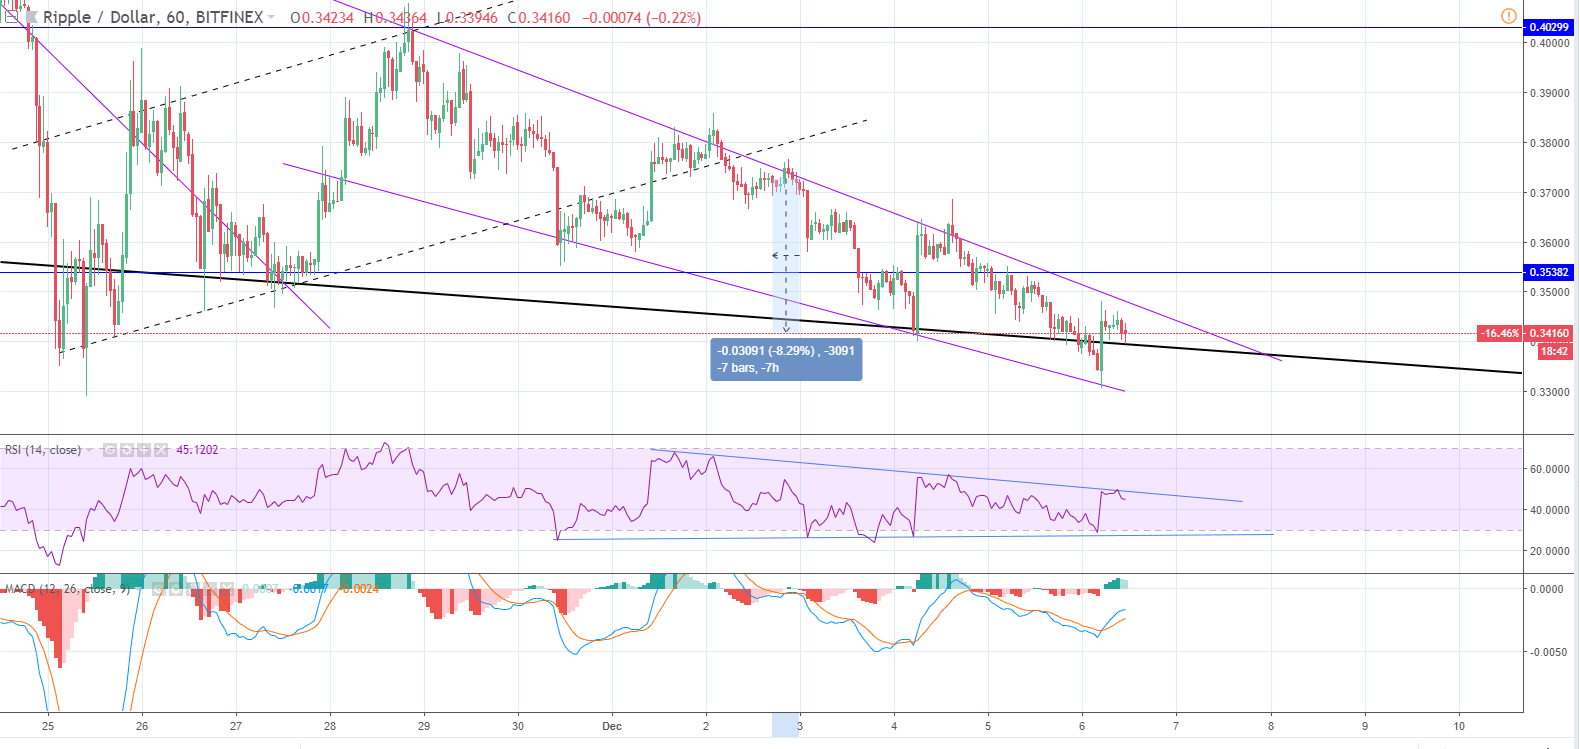
The hourly chart shows that the price is still in a clear descending channel. The XRP/USD pair dipped below the bold black line, which is the baseline support from the current range, but the price moved above the level again.
We can also see that the price is on the prior low levels. Last time it was a support level and the price increased up to $0.4 from it. Thus, this level could serve as a support this time as well, but the pressure from the descending channel might be too strong and we could see a straight downfall from here.
RSI is showing a descending triangle pattern, which is a bearish sign, but MACD is getting bullish as the fast MA crossed the slow one from the upside and both of them heading in an upward trajectory.
Mostly likely that the price of Ripple is heading for another low, which may end as a wick on a higher time frame. We may expect a quick but large dip that could activate buying and attract new buyers with a “better price”.
Author

FXOpen Broker Team
FXOpen


