XRP/USD Technical Analysis: Ripple breaks higher but can it sustain the move?
- Ripple trades 2.4% higher today as general crypto sentiment improves across the board.
- The price has currently broken through the resistance level of 0.2255 but it needs a close to confirm.

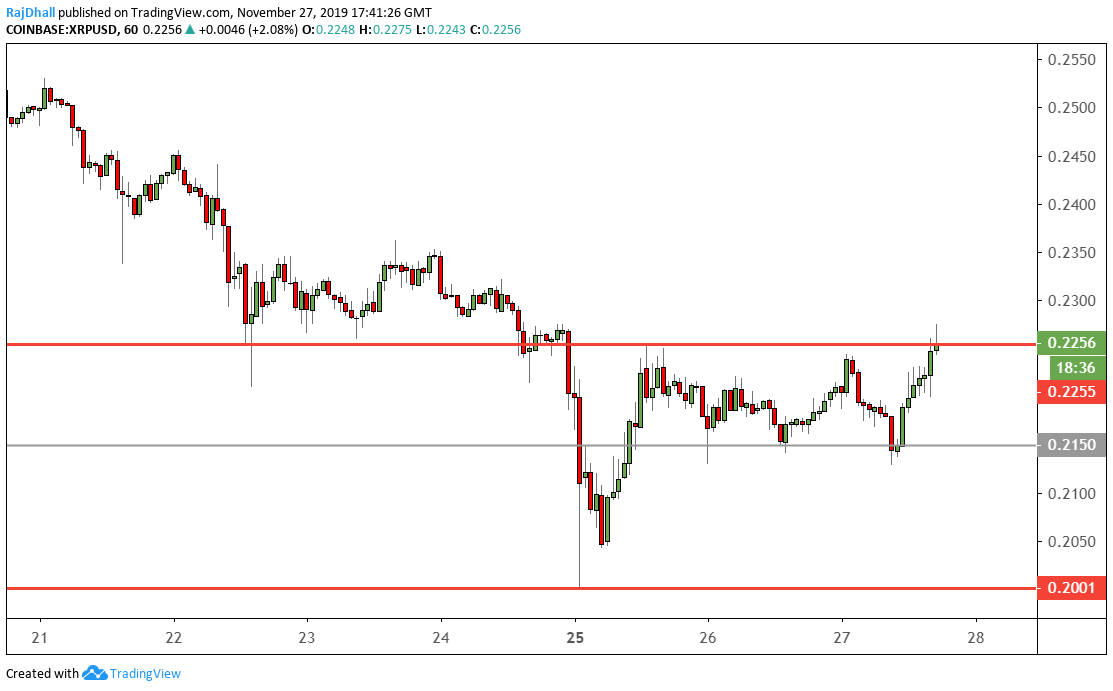
Ripple Hourly Price Chart
As you can see from the chart below the price has recently shot higher.
The 0.2255 level has been used on a number of occasions as a support and resistance level.
The next potential resistance lies at 0.2355 which has been respected on three occasions.
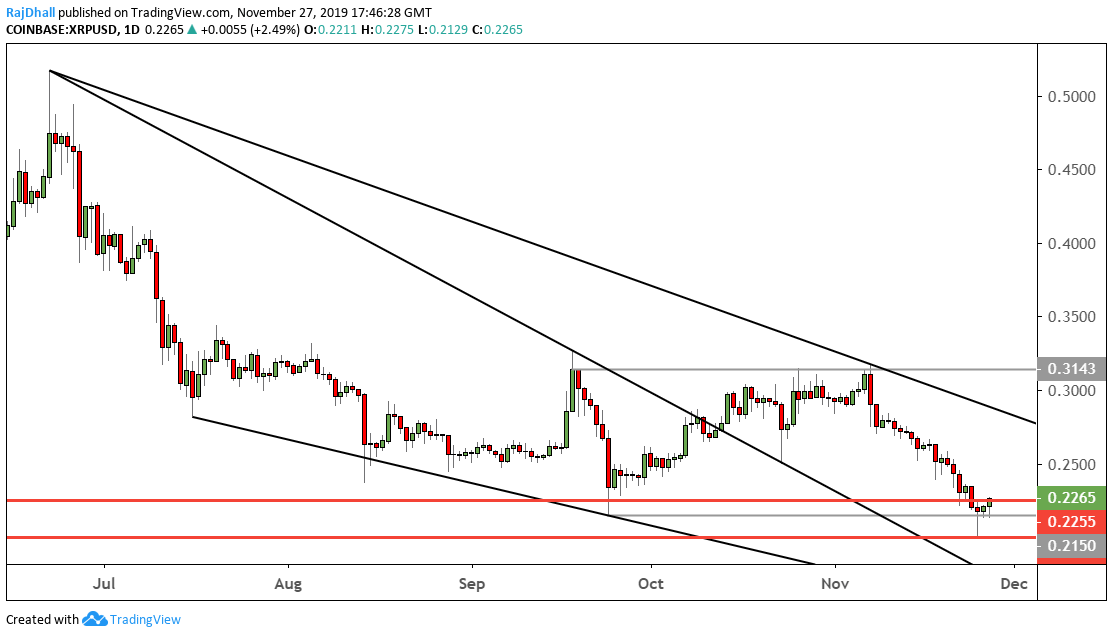
Ripple Daily Chart
The daily chart still looks under some serious pressure.
Although the lower timeframes have shown a bullish breakout the psychological 0.25 would be the level to beat on the higher timeframe.
Longer term the channel high is the main target for the bulls as the hammer candle two days ago provided a bullish signal.
Author

Rajan Dhall, MSTA
FX Daily
Rajan Dhall is an experienced market analyst, who has been trading professionally since 2007 managing various funds producing exceptional returns.
More from Rajan Dhall, MSTA


