XRP Technical Analysis: XRP/USD make or break
- XRP price was seen trading down just shy of 6% in the latter stages of Monday.
- XRP/USD retesting a vital near-term bottom, which could be catastrophic if broken.

XRP/USD daily chart
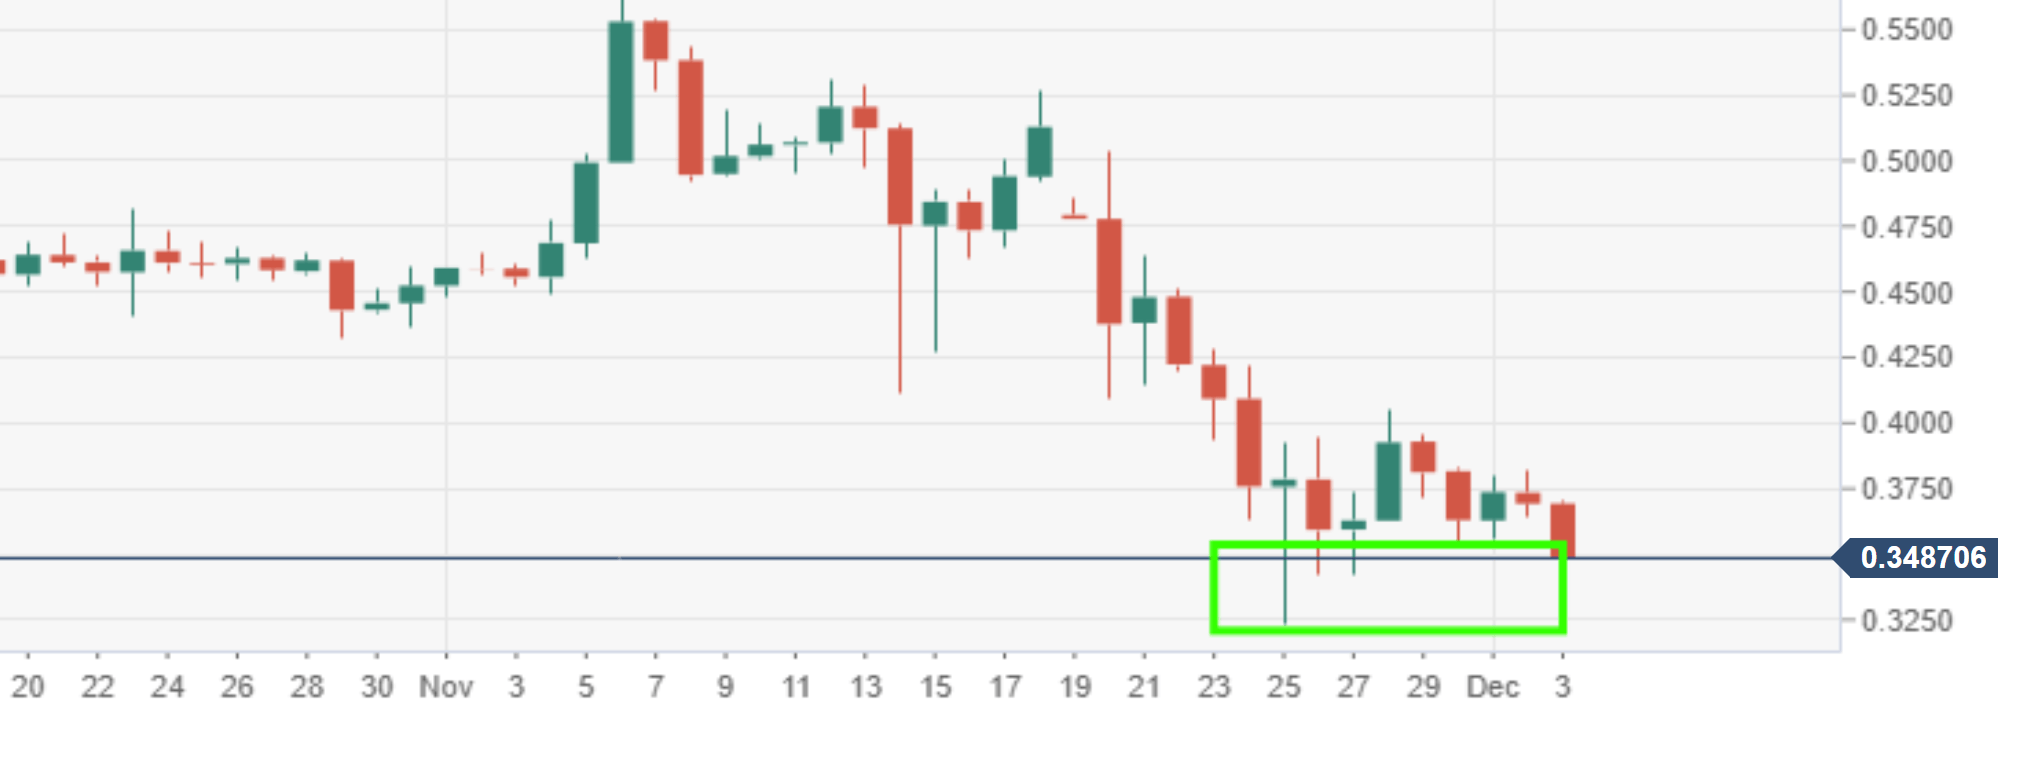
Spot rate: 0.3486
Relative change: -5.52%
High: 0.3699
Low: 0.3439
Trend: Bearish
Support 1: 0.3438, daily pivot point support.
Support 2: 0.3427, 26-27th November low.
Support 3: 0.3238, monthly low.
Resistance 1: 0.3795, daily pivot point resistance.
Resistance 2: 0.3795, daily pivot point resistance.
Resistance 3: 0.3897, daily pivot point resistance.
Author

Ken Chigbo
Independent Analyst
Ken has over 8 years exposure to the financial markets. He started his career as an analyst, covering a variety of asset classes; forex, fixed income, commodities and equities.


