XRP price shrugs off the FUD and surges alongside XLM, aiming for new full-blown reversal
- XRP price is up almost 50% in the past 24 hours after a massive breakout.
- XLM price was up by around 220% in the past week as it seems to be the alternative of XRP.

It seemed that XRP investors were switching their focus onto XLM as a potential alternative in the short-term. XLM price exploded by more than 200% reaching $0.411 while XRP remained trading sideways. However, out of the blue, XRP price saw a 50% rise and broke above several resistance levels hitting $0.36, shrugging off the FUD (fear, uncertainty, doubt) of the ongoing SEC vs. Ripple saga.
Can XRP price mimic XLM and hit a new high above $0.85?
For the most part since October 2020, both XRP and XLM were strongly correlated. The correlation was significantly broken on January 2 by XLM price. Now several days later, XRP seems to have taken the initiative after a 50% rally, trying to regain its correlation.

XRP/XLM correlation chart
XRP price is around $0.338 at the time of writing after getting rejected from the daily 50-SMA at $0.35. Despite the huge bounce, XRP bulls need to climb above this level and turn it into support to increase their odds of pushing XRP price towards $0.85.
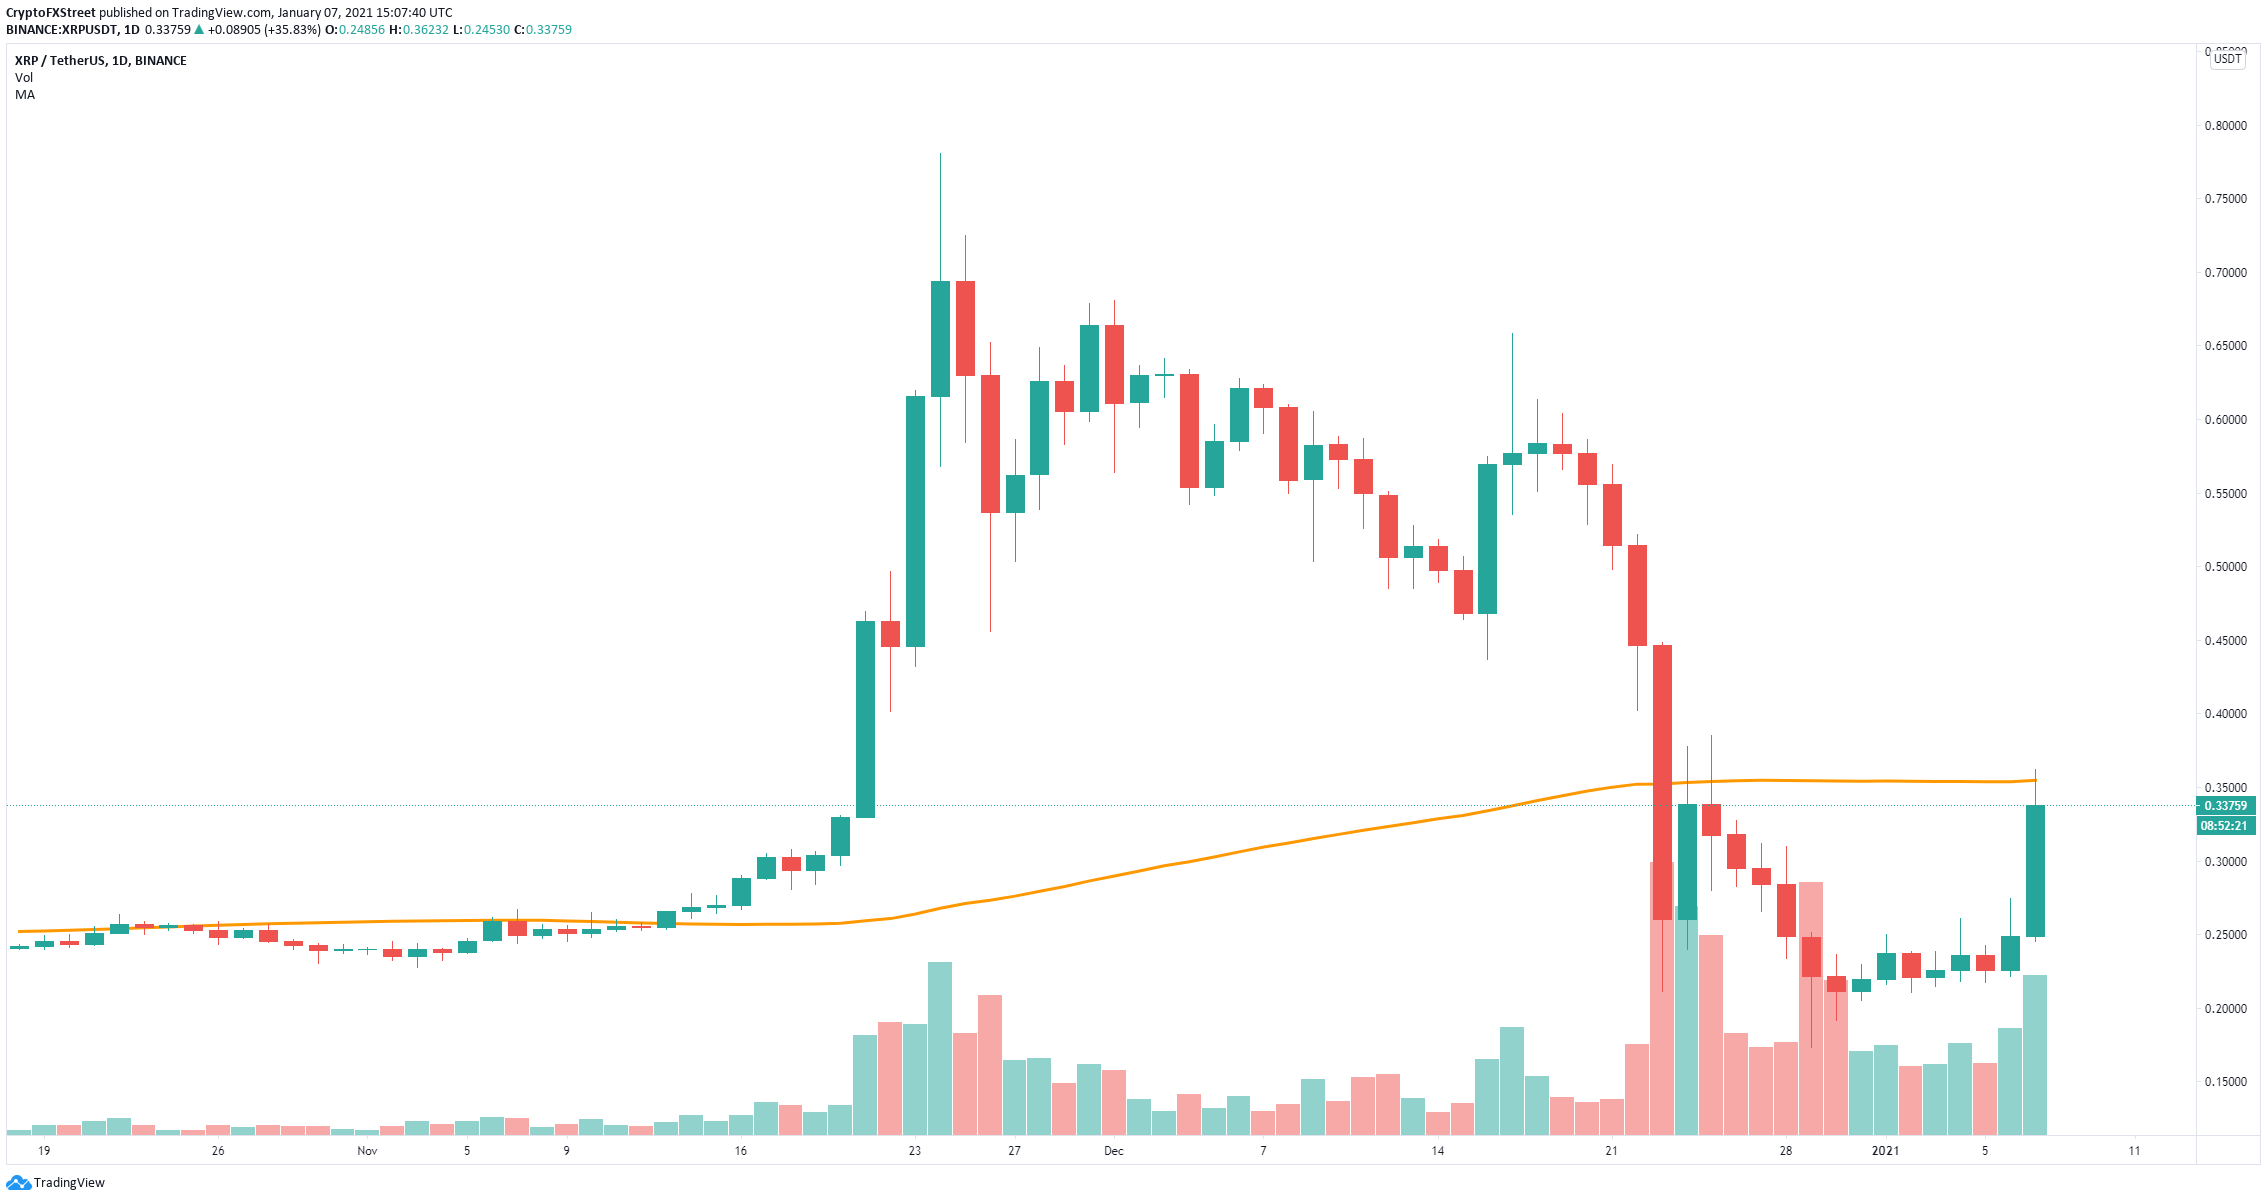
XRP/USD daily chart
However, large XRP holders seem to have no interest in the digital asset just yet. The number of whales holding between 1,000,000 and 10,000,000 coins remains the same. Similarly, the amount of larger holders with at least 10,000,000 has only increased by one.
%20[16.10.22,%2007%20Jan,%202021]-637456295068812156.png)
XRP Holders Distribution chart
Unfortunately, the TD Sequential indicator has just presented a sell signal on the 2-hour chart and it’s about to do the same on the 4-hour chart. This indicates that XRP price could be on the verge of a short-term correction, potentially down to $0.3.
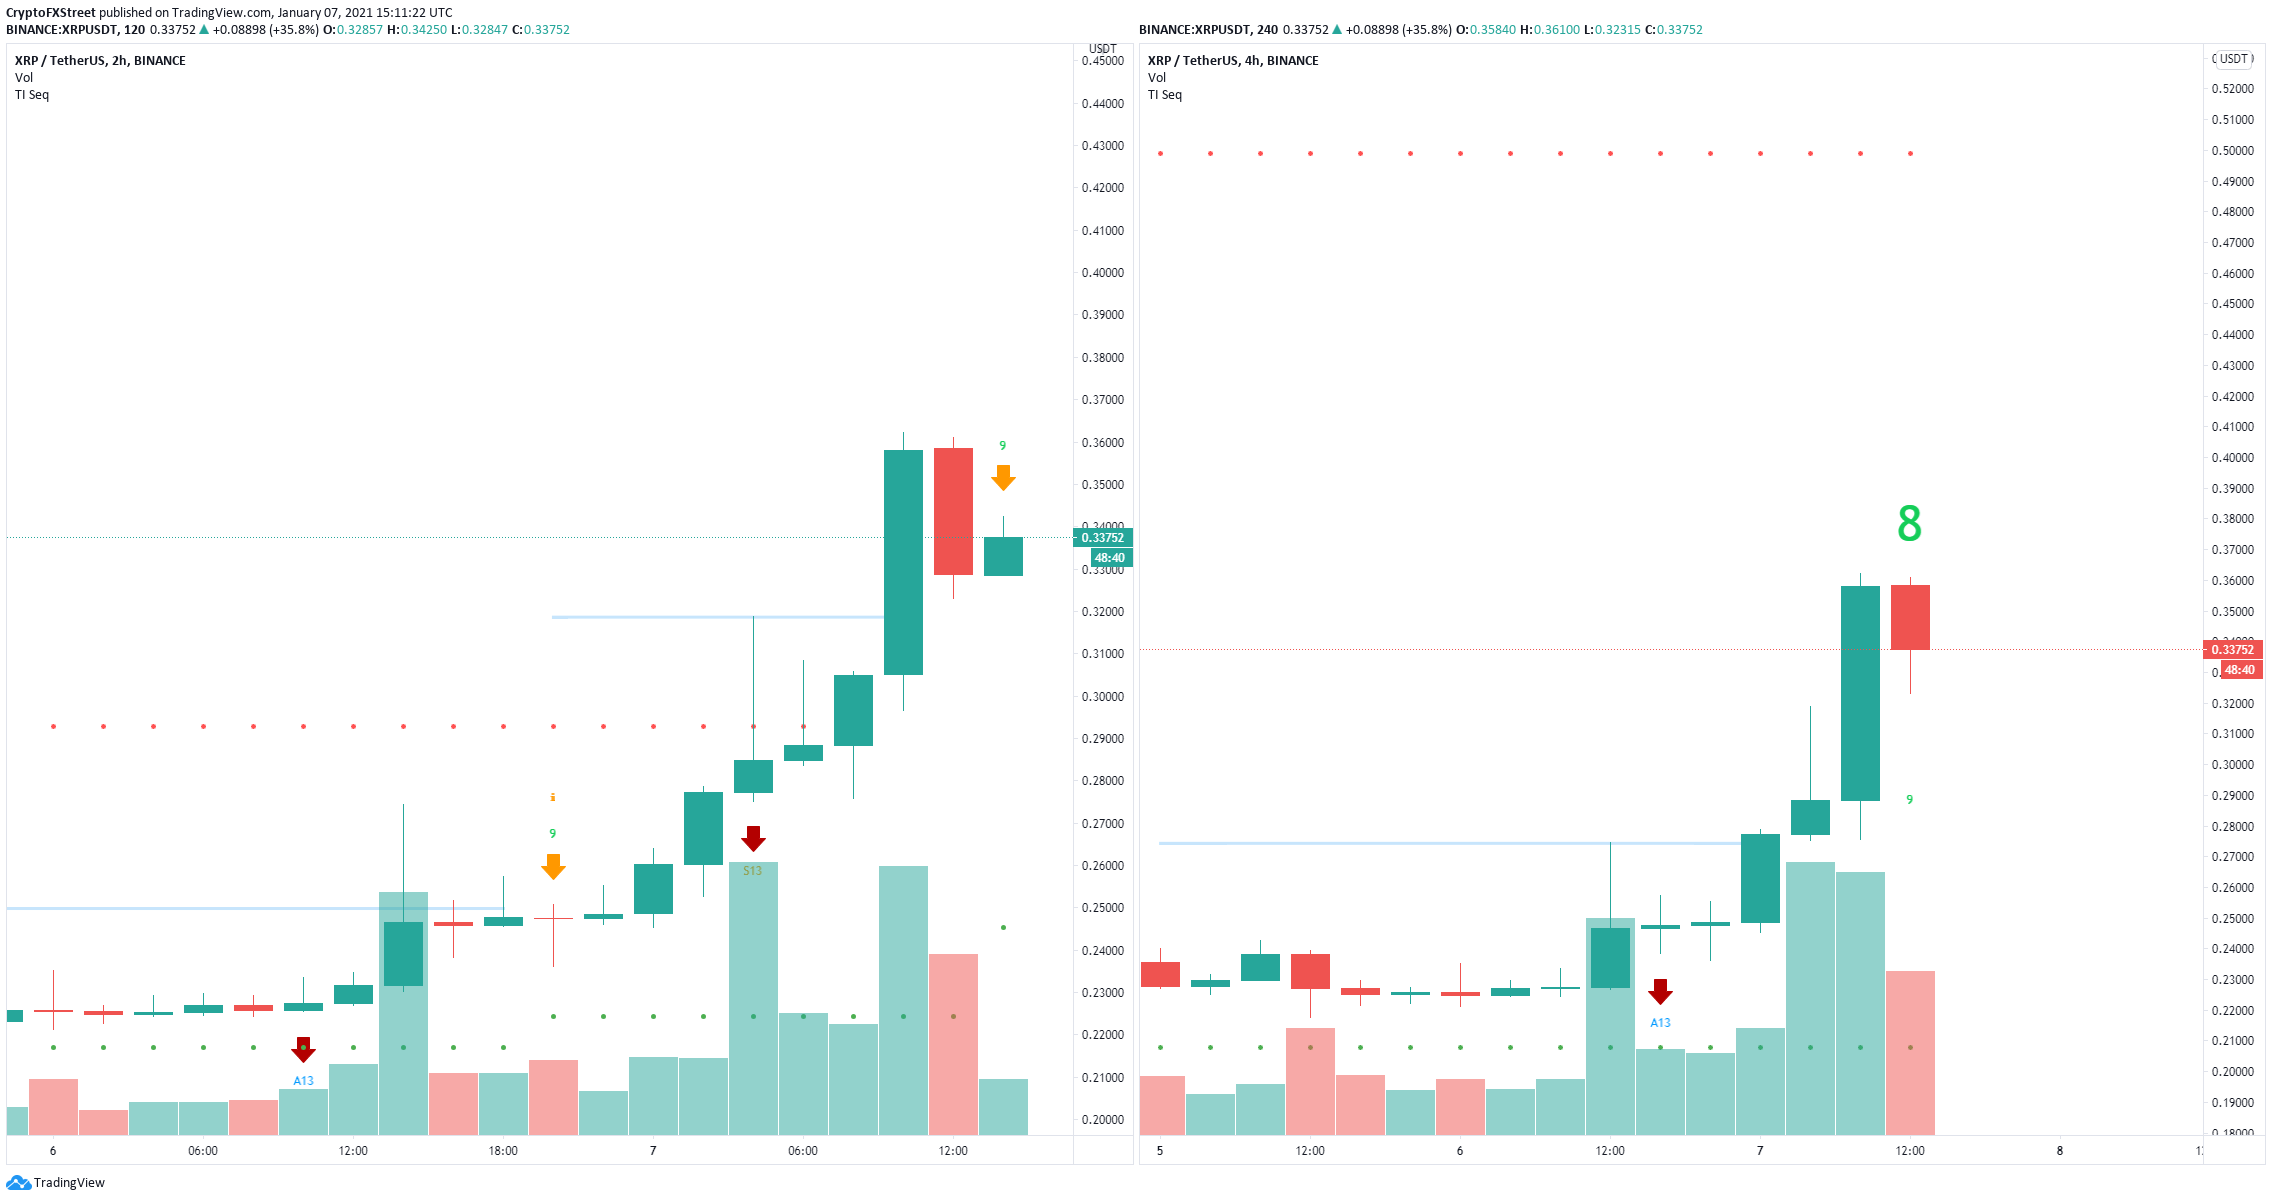
XRP sell signals chart
XLM price could also be on the verge of a correction
Stellar is up by more than 200% in the past week and has not seen any significant pullbacks just yet. It’s very likely that the digital asset is poised for a short-term correction after such a significant rally.
%20[16.15.22,%2007%20Jan,%202021]-637456295017246399.png)
XLM Social Volume chart
The Social Volume metric calculates the amount of mentions of the coin on more than 1,000 crypto social media channels. This number has seen a massive spike in the past few days, higher than during the XLM price peak in January 2018. This could indicate that the digital asset is poised for a correction soon.
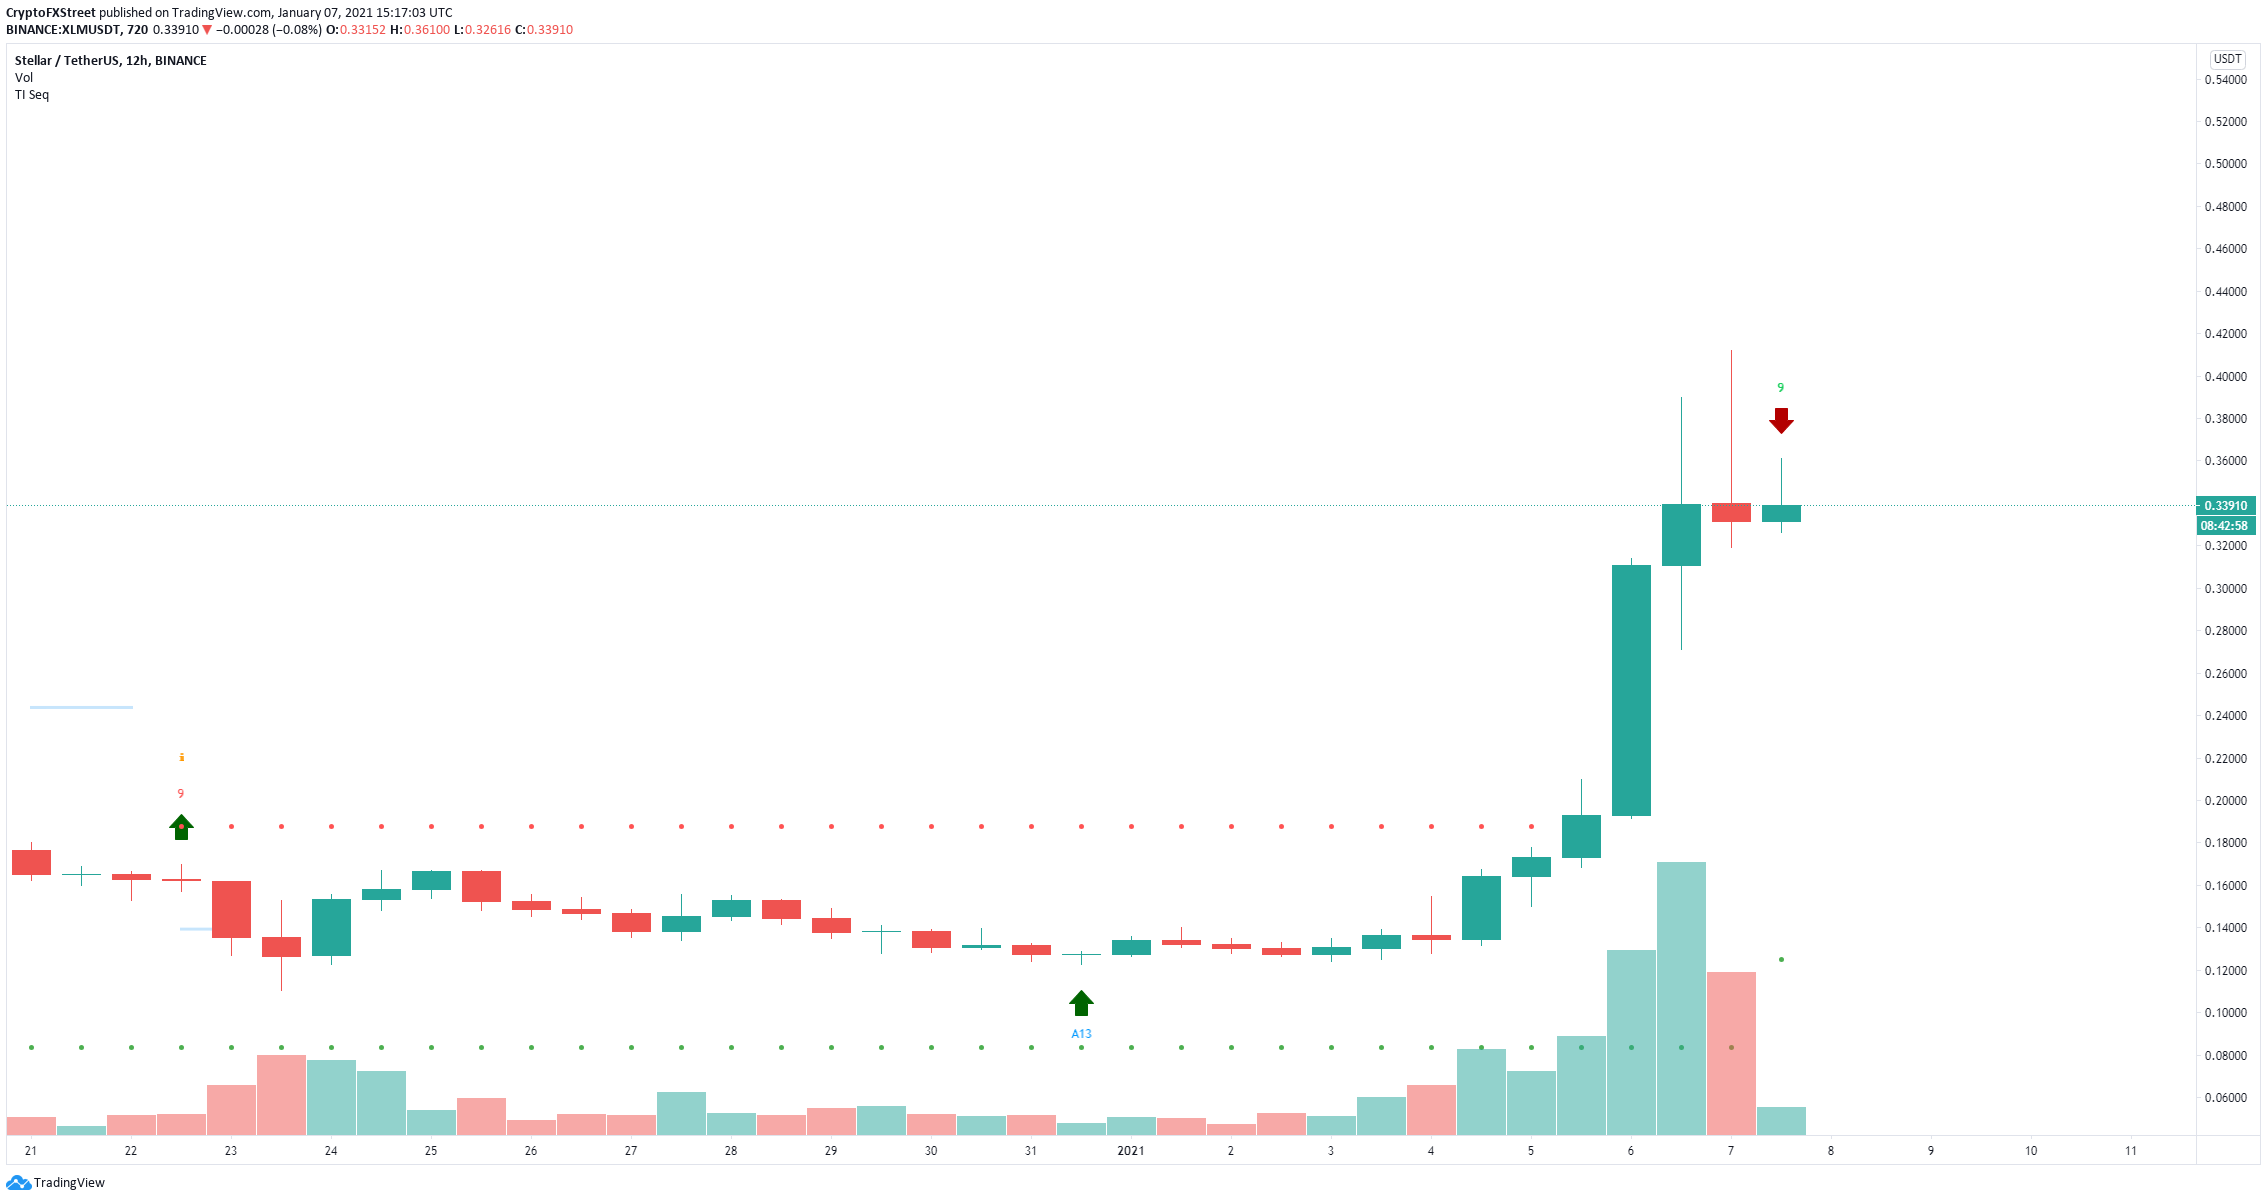
XLM/USD 12-hour chart
Furthermore, on the 12-hour chart, the TD Sequential indicator has just presented a sell signal. There is very little support on the way down, but the most likely price target will be the psychological level at $0.3.
Author

Lorenzo Stroe
Independent Analyst
Lorenzo is an experienced Technical Analyst and Content Writer who has been working in the cryptocurrency industry since 2012. He also has a passion for trading.


