|

XLM Price Prediction: Stellar has a bearish fakeout and recovers immediately

  • XLM price has been trading inside a tightening range on the 4-hour chart for the past two weeks.
  • The digital asset had a bearish breakdown that turned out to be a fakeout as bulls quickly bought the dip.

After a significant rally to $0.411, XLM price has been trading sideways for the past two weeks awaiting a clear breakout or breakdown. On January 20, Stellar had a breakdown below a crucial support level, but saw no bearish continuation. 

XLM price recovers from bearish breakdown and targets $0.40 again

On the 4-hour chart, the Bollinger Bands were extremely squeezed and the bears saw a breakdown around 12 hours ago that turned out to be a fakeout as bulls quickly bought the dip at $0.273, pushing the digital asset to a current price of $0.291. 

xlm price

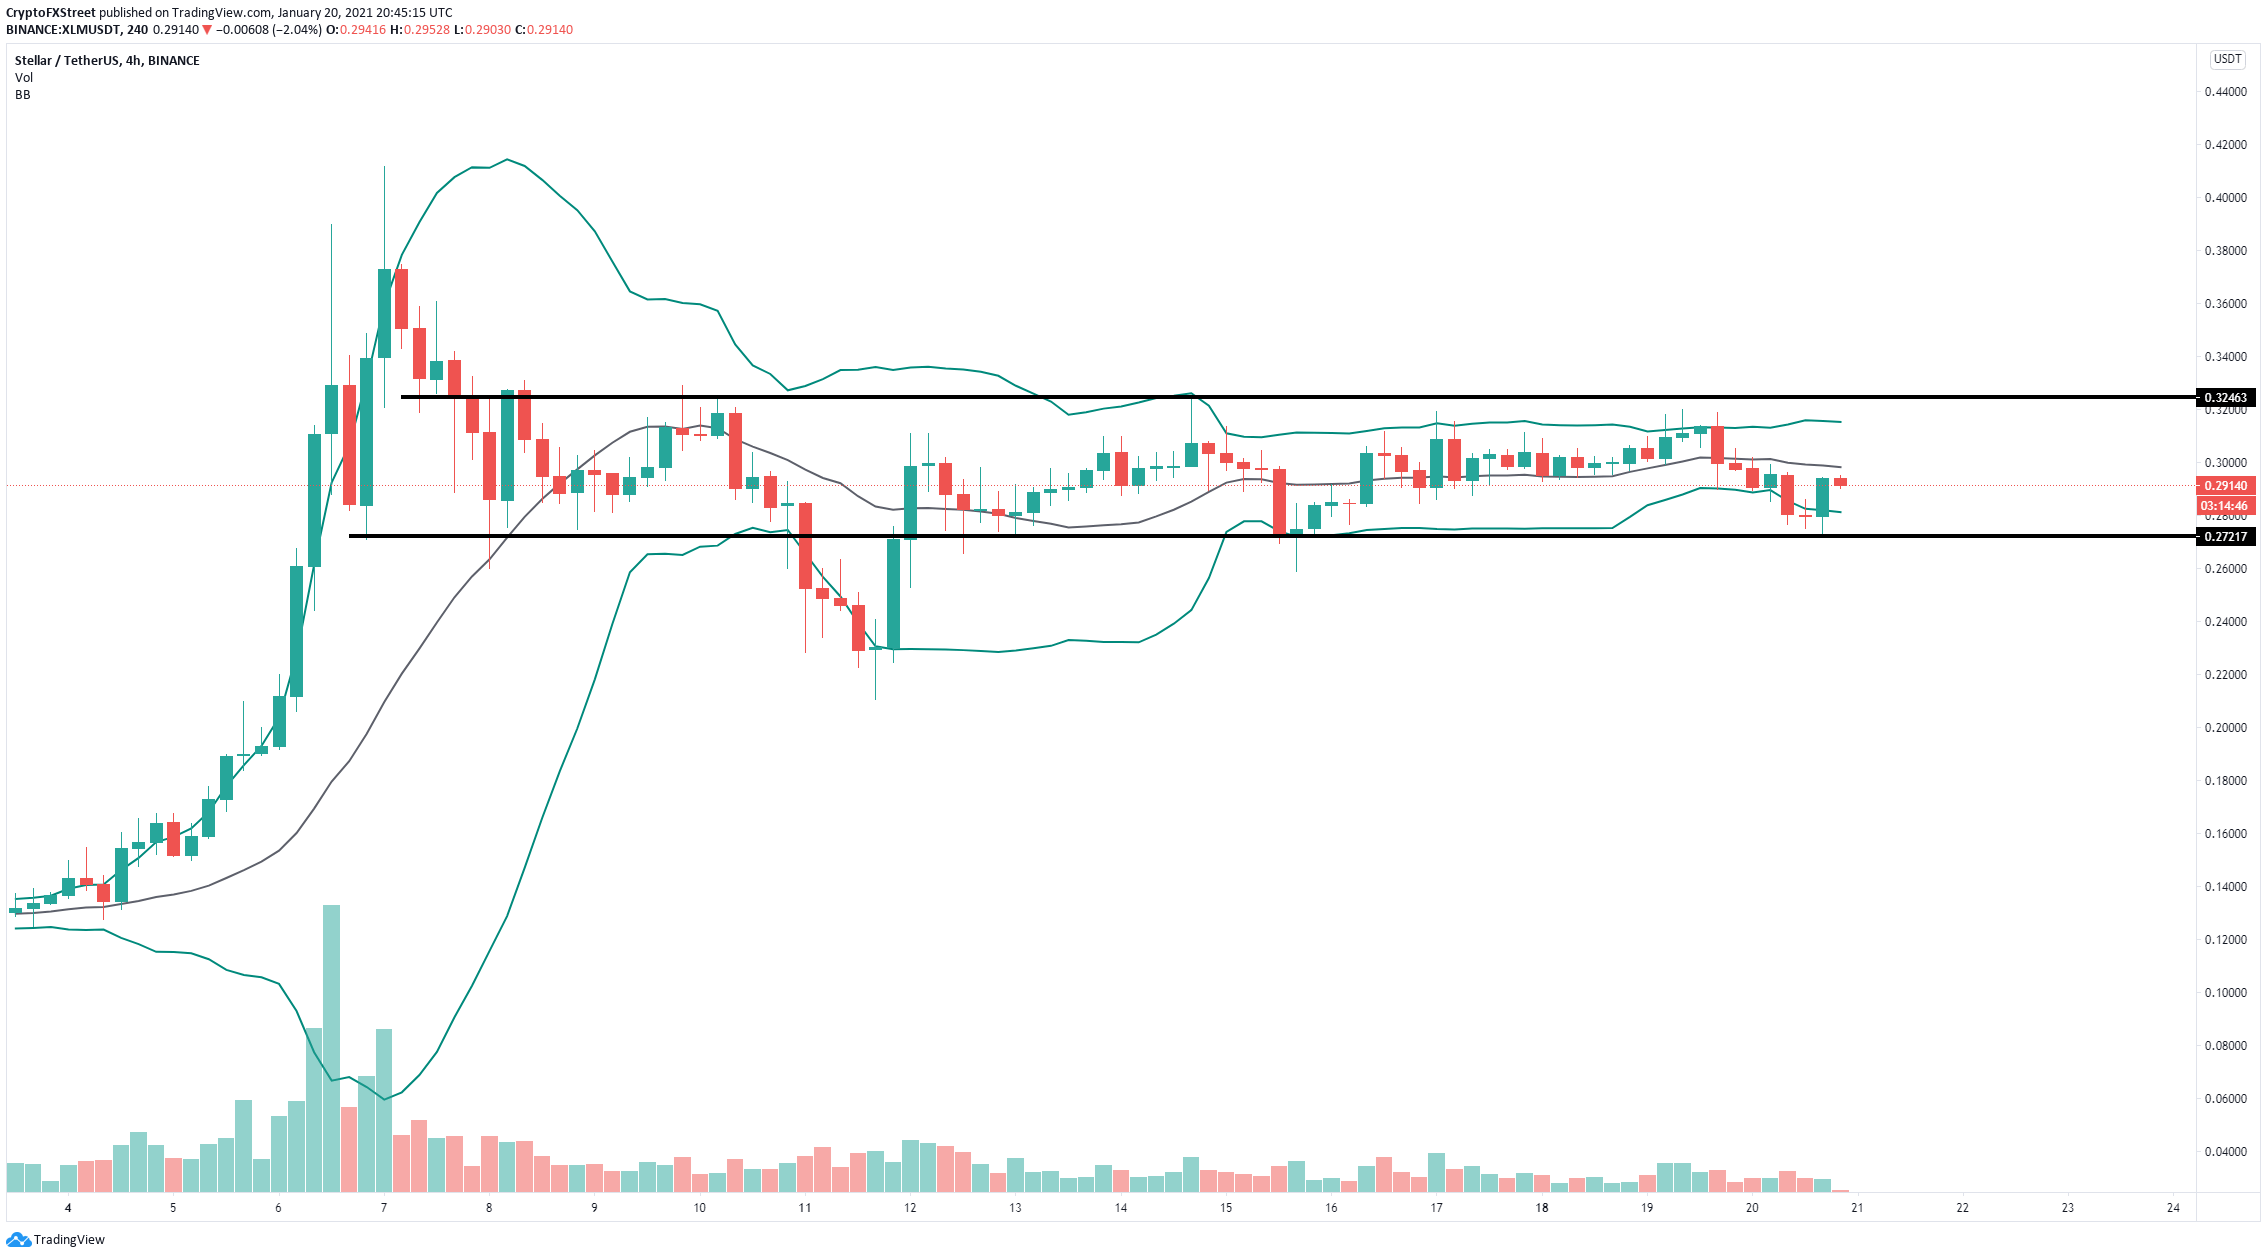
XLM/USD 4-hour chart

Stellar is trading inside a static range between $0.324 and $0.272 on the 4-hour chart. The upper Bollinger Band coincides with the resistance level at $0.324. As XLM has rebounded from the fakeout, a breakout above this critical point is likely and can drive its price towards $0.4.

On the other hand, the middle Bollinger band could act as a resistance level at $0.30 rejecting XLM price and pushing it towards $0.272. A breakdown below this point would quickly move Stellar to $0.2.

Author

Lorenzo Stroe

Lorenzo Stroe

Independent Analyst

Lorenzo is an experienced Technical Analyst and Content Writer who has been working in the cryptocurrency industry since 2012. He also has a passion for trading.

More from Lorenzo Stroe
Share:

Editor's Picks

Ripple ticks up as buyers re-engage

Ripple trends higher at the time of writing on Thursday, trading above $1.12. The cross-border remittance token seeks to erase a persistent downtrend that has weighed on the price since mid-May, as investors navigated geopolitical tensions in the Middle East.

Crypto Today: Bitcoin, Ethereum, XRP rebound broadens despite continued US-Iran strikes

Bitcoin steadies its recovery on Thursday, edging higher toward $63,000 despite incessant capital outflows. Meanwhile, altcoins, including Ethereum and Ripple, exhibit subtle rebound signs, trading above $1,650 and $1.12, respectively.

Bitcoin stages modest rebound ahead of US PPI data

Bitcoin recovers slightly, trading above $62,500 on Thursday after three consecutive days of losses. US-listed spot ETFs recorded outflows of $213.85 million on Wednesday, indicating persistent withdrawals amid renewed US-Iran tensions.

Pi Network: Recovery at risk with 16 million PI tokens ready for unlock

Pi Network edges higher on Thursday after three days of consecutive losses earlier this week, extending the prevailing downtrend since late April. The scheduled unlocking of 16 million PI tokens on Thursday could add pressure to the intraday recovery.

Bitcoin: After the bloodbath, everyone looks at $60,000
Bitcoin (BTC) hovers above $62,000 at the time of writing on Friday, weighed down by growing risk-off sentiment due to persistent geopolitical tensions in the Middle East and sticky macroeconomic uncertainty. The institutional sell-off continued to wreak havoc on capital flows, with spot Bitcoin Exchange-Traded Funds (ETFs) recording billions in outflows.