|

XLM Price Prediction: Stellar awaits a massive breakout but remains inside a no-trade zone

  • XLM price has been trading sideways for the past week.
  • The digital asset awaits a clear signal to see a breakout or breakdown.

XLM has continued to trade sideways since we last reported about it. The digital asset remains locked inside a tightening range which will eventually burst. Let’s analyze some of the most important indicators to understand the most likely scenario.

XLM Price could look at a 20% breakout in the short-term

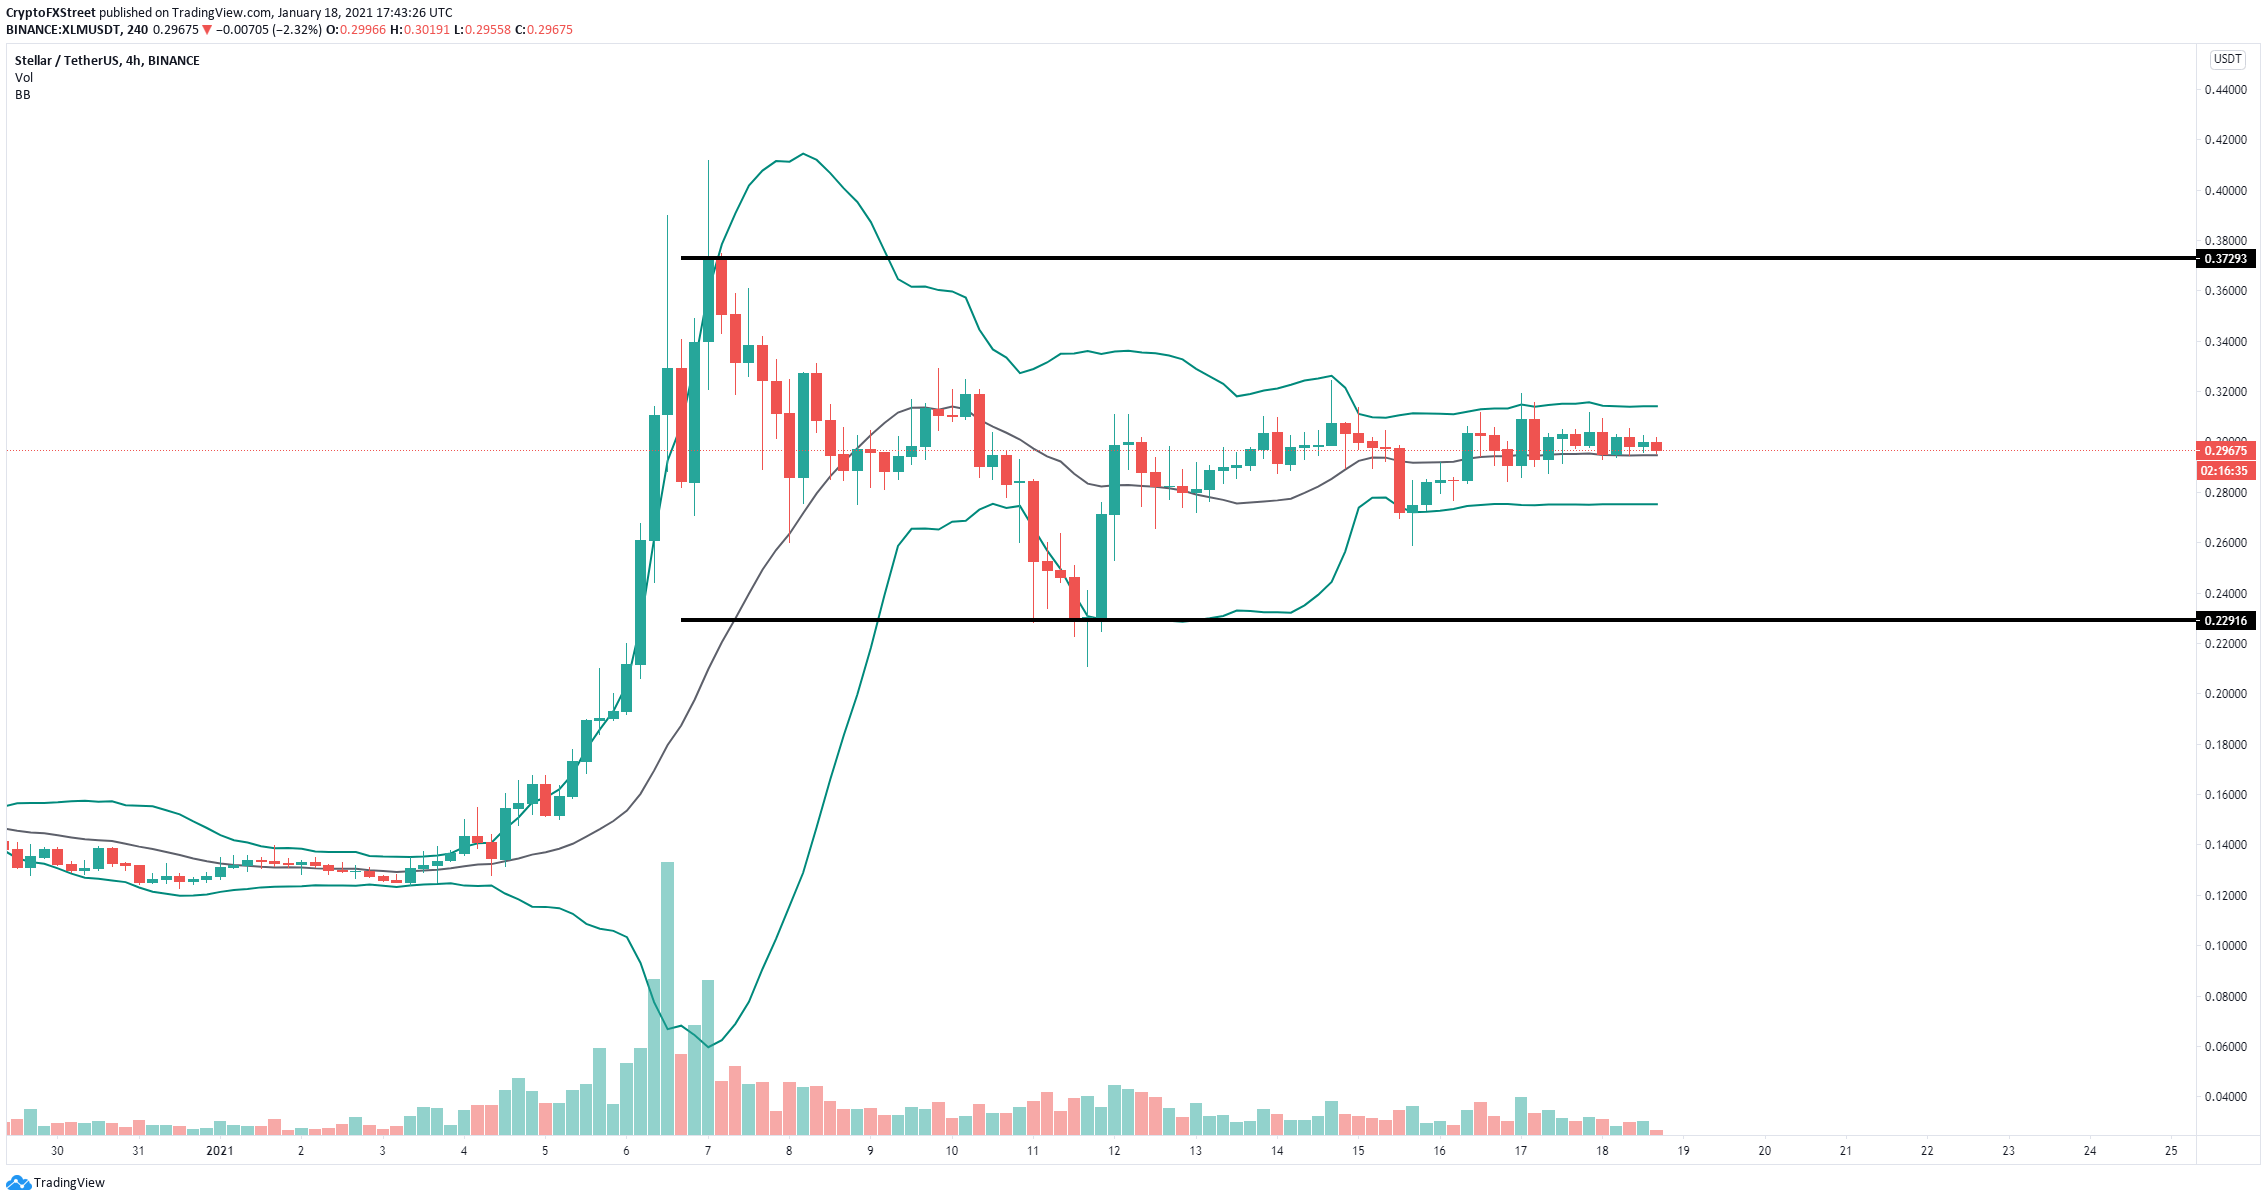
On the 4-hour chart, XLM has been trading sideways in a tightening range between $0.276 and $0.316. The Bollinger Bands have been squeezing notable since January 14 and indicate the digital asset is on the verge of a breakout or breakdown. 
xlm price

XLM/USD 4-hour chart

Additionally, XLM’s trading volume also dropped massively in the past few days, which is another indication of a potential breakout or breakdown. Considering the overall trend is bullish, a breakout is more likely if the bulls can push XLM price above $0.316. The short-term price target would be $0.372.

On the other hand, if the bears can see some momentum on the way down and can crack the significant support level at $0.276, XLM price can quickly fall towards $0.23

Author

Lorenzo Stroe

Lorenzo Stroe

Independent Analyst

Lorenzo is an experienced Technical Analyst and Content Writer who has been working in the cryptocurrency industry since 2012. He also has a passion for trading.


More from Lorenzo Stroe
Share:

Editor's Picks

XRP defends $1.30 support as Ripple partners with Arf to bring RLUSD settlement liquidity to XRPL

Ripple holds near recently confirmed support at $1.30 on Friday, as bulls eye a short-term recovery toward $1.40. The remittance token’s upside remains capped by structural levels, suggesting recovery would depend on whether buyers can sustain momentum.

Bitcoin Weekly Forecast: BTC extends pullback as ETF inflows clash with risk-off sentiment

Bitcoin remains under pressure, trading around $81,800 on Friday, recording modest losses so far this week. Despite a mild pullback, institutional demand showed signs of a comeback with spot ETFs recording $442.67 million in net inflows through Thursday.

Crypto Today: Bitcoin holds the 50-day EMA as Ethereum and XRP face structural resistance

Bitcoin gradually ticks up on Friday, trading above $81,000. The Crypto King has recently defended structural support near $80,000, reinforcing the prevailing bullish outlook. Ethereum similarly edges higher above $2,400, while Ripple trades above $1.32 after testing support around $1.30.

Pi Network holds modest gains as mixed technicals curb upside

Pi Network (PI) price is up 2% on Friday, showing signs of recovery while the broader cryptocurrency market faces near-term weakness. The crypto market sentiment eases to neutral from bullish amid rising long liquidations.

Bitcoin extends pullback as ETF inflows clash with risk-off sentiment

Bitcoin remains under pressure, trading around $81,800 on Friday, recording modest losses so far this week. Despite a mild pullback, institutional demand showed signs of a comeback with spot Exchange Traded Funds recording $442.67 million in net inflows through Thursday.

