XLM Price Forecast: Stellar may be on the brink of a 50% collapse
- XLM price trades to a different tune as it tries to sustain price above a symmetrical triangle’s lower trend line.
- Stellar 200-day simple moving average (SMA) looms large over any price traction that may emerge.
- Volume runs well below the 50-day average, revealing no accumulation or distribution by investors.

XLM price has been propped up by the symmetrical triangle’s lower trend line and 61.8% Fibonacci retracement level of the March 2020-May 2021 rally. However, the resulting rebound has been limited, unaffected by the Bitcoin burst higher since the El Salvador announcement to make BTC legal tender. Without a daily close above the 200-day SMA at $0.379, the cryptocurrency price path will be carrying a downward bias.
XLM price decoupling from Bitcoin follows altcoin script
XLM price correction in May was a wicked reminder of the risks inherent in cryptocurrency investing, as Stellar collapsed 65% into the May 23 low. Not only did it remove the pockets of anxiety and weak holders, but the decline also abolished a historic rally from the March 2020 low.
The proceeding price action has taken the form of a symmetrical triangle as XLM price has oscillated in a tighter range with noticeably lower than average volume. The current location of Stellar below the 200-day SMA and the triangle’s upper trendline, which just crossed below the moving average, presents a challenge for bullish Stellar investors.
The measured move of the symmetrical triangle is nearly 50%. A resolution to the downside could motivate an XLM price decline to $0.166, which is well below the 78.6% retracement of the March 2020-May 2021 advance. It would be a significant blow to Stellar; a network envisioned to boost financial inclusion by reaching the world’s unbanked.
To confirm a resolution to the downside, XLM price needs a daily close below the June 12 low at $0.300. It would almost guarantee a sweep below the May 23 low of $0.274 and raise the odds that Stellar will resume the brutal correction, potentially to the measured move target of $0.166.
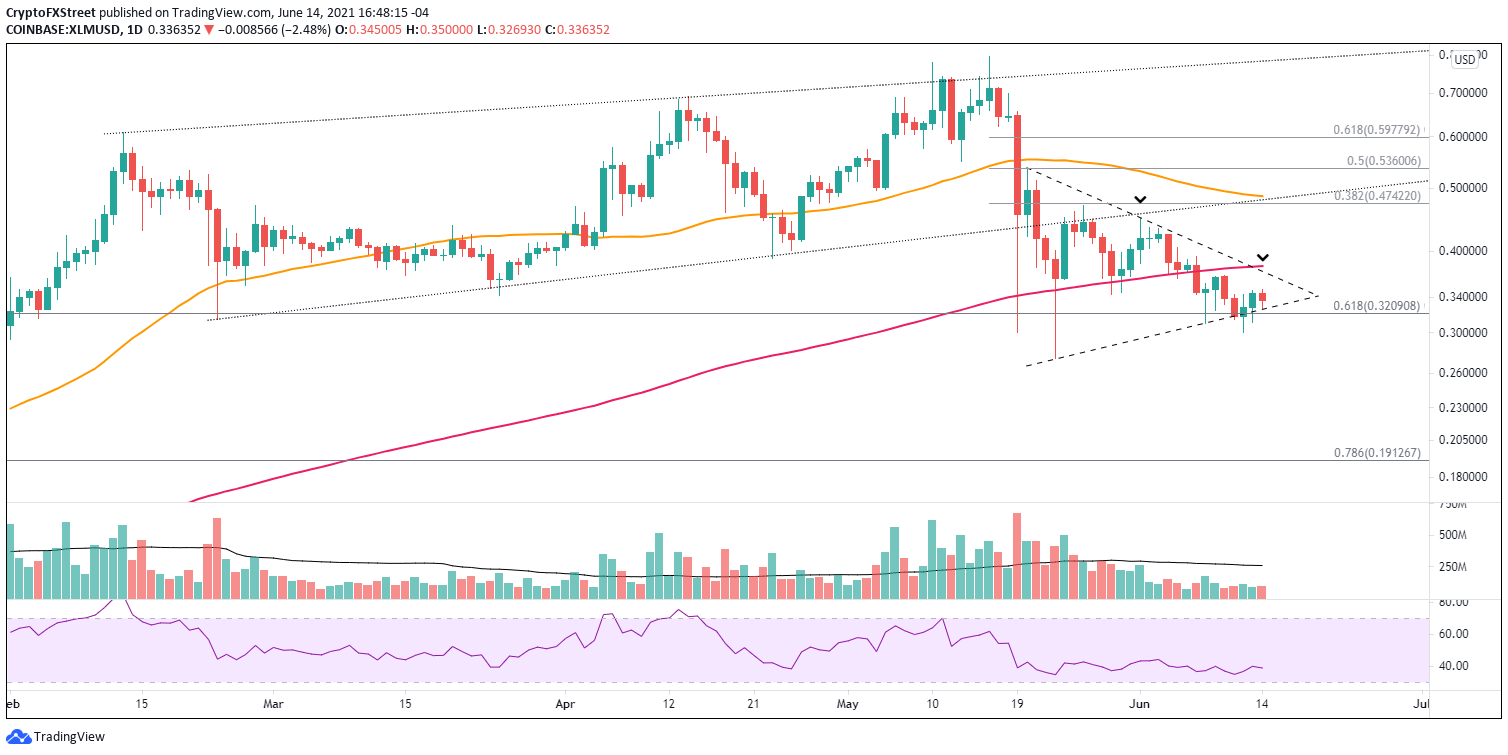
XLM/USD daily chart
XLM price can avoid a bearish fate by beginning with a daily close above the triangle’s upper trend line and the dominant 200-day SMA, currently at $0.379. After that, Stellar would be free to rally to the intersection of the 38.2% retracement of the May correction at $0.474 with the declining 50-day SMA at $0.486. Thus, it would be a 30% gain for timely Stellar investors.
Like other altcoins, XLM has struggled to break the bounds of a symmetrical triangle and the resistance enforced by the 200-day SMA. As a result, the outlook for Stellar also is not much different, neutral with a bearish tilt.
Author

Sheldon McIntyre, CMT
Independent Analyst
Sheldon has 24 years of investment experience holding various positions in companies based in the United States and Chile. His core competencies include BRIC and G-10 equity markets, swing and position trading and technical analysis.


