Worst month for BTC price in 10 years: Five things to watch in Bitcoin

Bitcoin (BTC) starts a new week bearish or as a firm “buy” depending on the source — what happens next?
After a week of uninspiring price performance, the largest cryptocurrency is still stuck in the lower $30,000 range.
With inflation worrying traditional markets and summer months traditionally good for bulls, there may yet be cause for celebration. In Bitcoin, anything can happen, however, and surprises swing both ways.
Cointelegraph Markets takes a look at five factors to consider when charting where BTC/USD might head next.
Inflation spooks macro mood
It’s a quiet day for stocks and commodities thanks to holidays in the United States, United Kingdom, and elsewhere in the West.
That said, Asian markets are mostly stable anyway, as traders gear up for the beginning of the traditionally slower summer period.
Zooming out, however, and the picture gets decidedly less steady. The reason, sources are telling mainstream media, is inflation.
Long a concern amid the international rebound from coronavirus fuelled by huge central bank liquidity creation, the long-term impact of engineered “recoveries” worldwide is looming large in the horizon.
Some telltale signs are already here, such as spiralling manufacturing costs which may not be fully reflected.
“Policy makers have committed to accepting a higher level of inflation, higher volatility in inflation and as that happens you will see inflation moving structurally higher,” Mixo Das, an equity strategist at JPMorgan Asia, told Bloomberg.
“I don’t think this is in the prices yet.”

Federal Reserve balance sheet annotated chart. Source: PlanB/ Twitter
Inflation is by its very nature the antithesis of a Bitcoin standard, given the cryptocurrency’s fixed supply and diminishing issuance curve which cannot be manipulated.
As such, demand from institutions and those with large exposure to cash should continue to expand in line with inflation, which is being increasingly tolerated by central banks at higher levels.
In a debate about Bitcoin’s energy usage earlier this month, Saifedean Ammous, author of “The Bitcoin Standard,” suggested that around 10% of global wealth is already eradicated by inflation every year.
Weak hands can't stop selling
It’s a somewhat gloomy picture for Bitcoin hodlers on Monday as the weekend failed to produce signs of a bullish price rebound.
At the time of writing, BTC/USD is under $36,000, having slowly drifted downwards since hitting local highs of $41,000 last week.
Those highs came soon after another retest of $30,000 support which saw Bitcoin bounce at $31,000, reestablishing the familiar trading corridor it has moved in since the capitulation event earlier in May.
Depending on who you ask, this setup is either a golden accumulation opportunity or a nightmare — and the split seems to match with market experience.
According to fresh data from on-chain monitoring resource Glassnode, at current levels, old hands are adding to their BTC stack, while recent buyers continue to sell to them.
This classic “weak-hands-to-strong” direction is nothing new, but its pace is increasing.
Miners, too, are back to buying, reversing a brief cascade of selling which accompanied the first dip to $30,000.
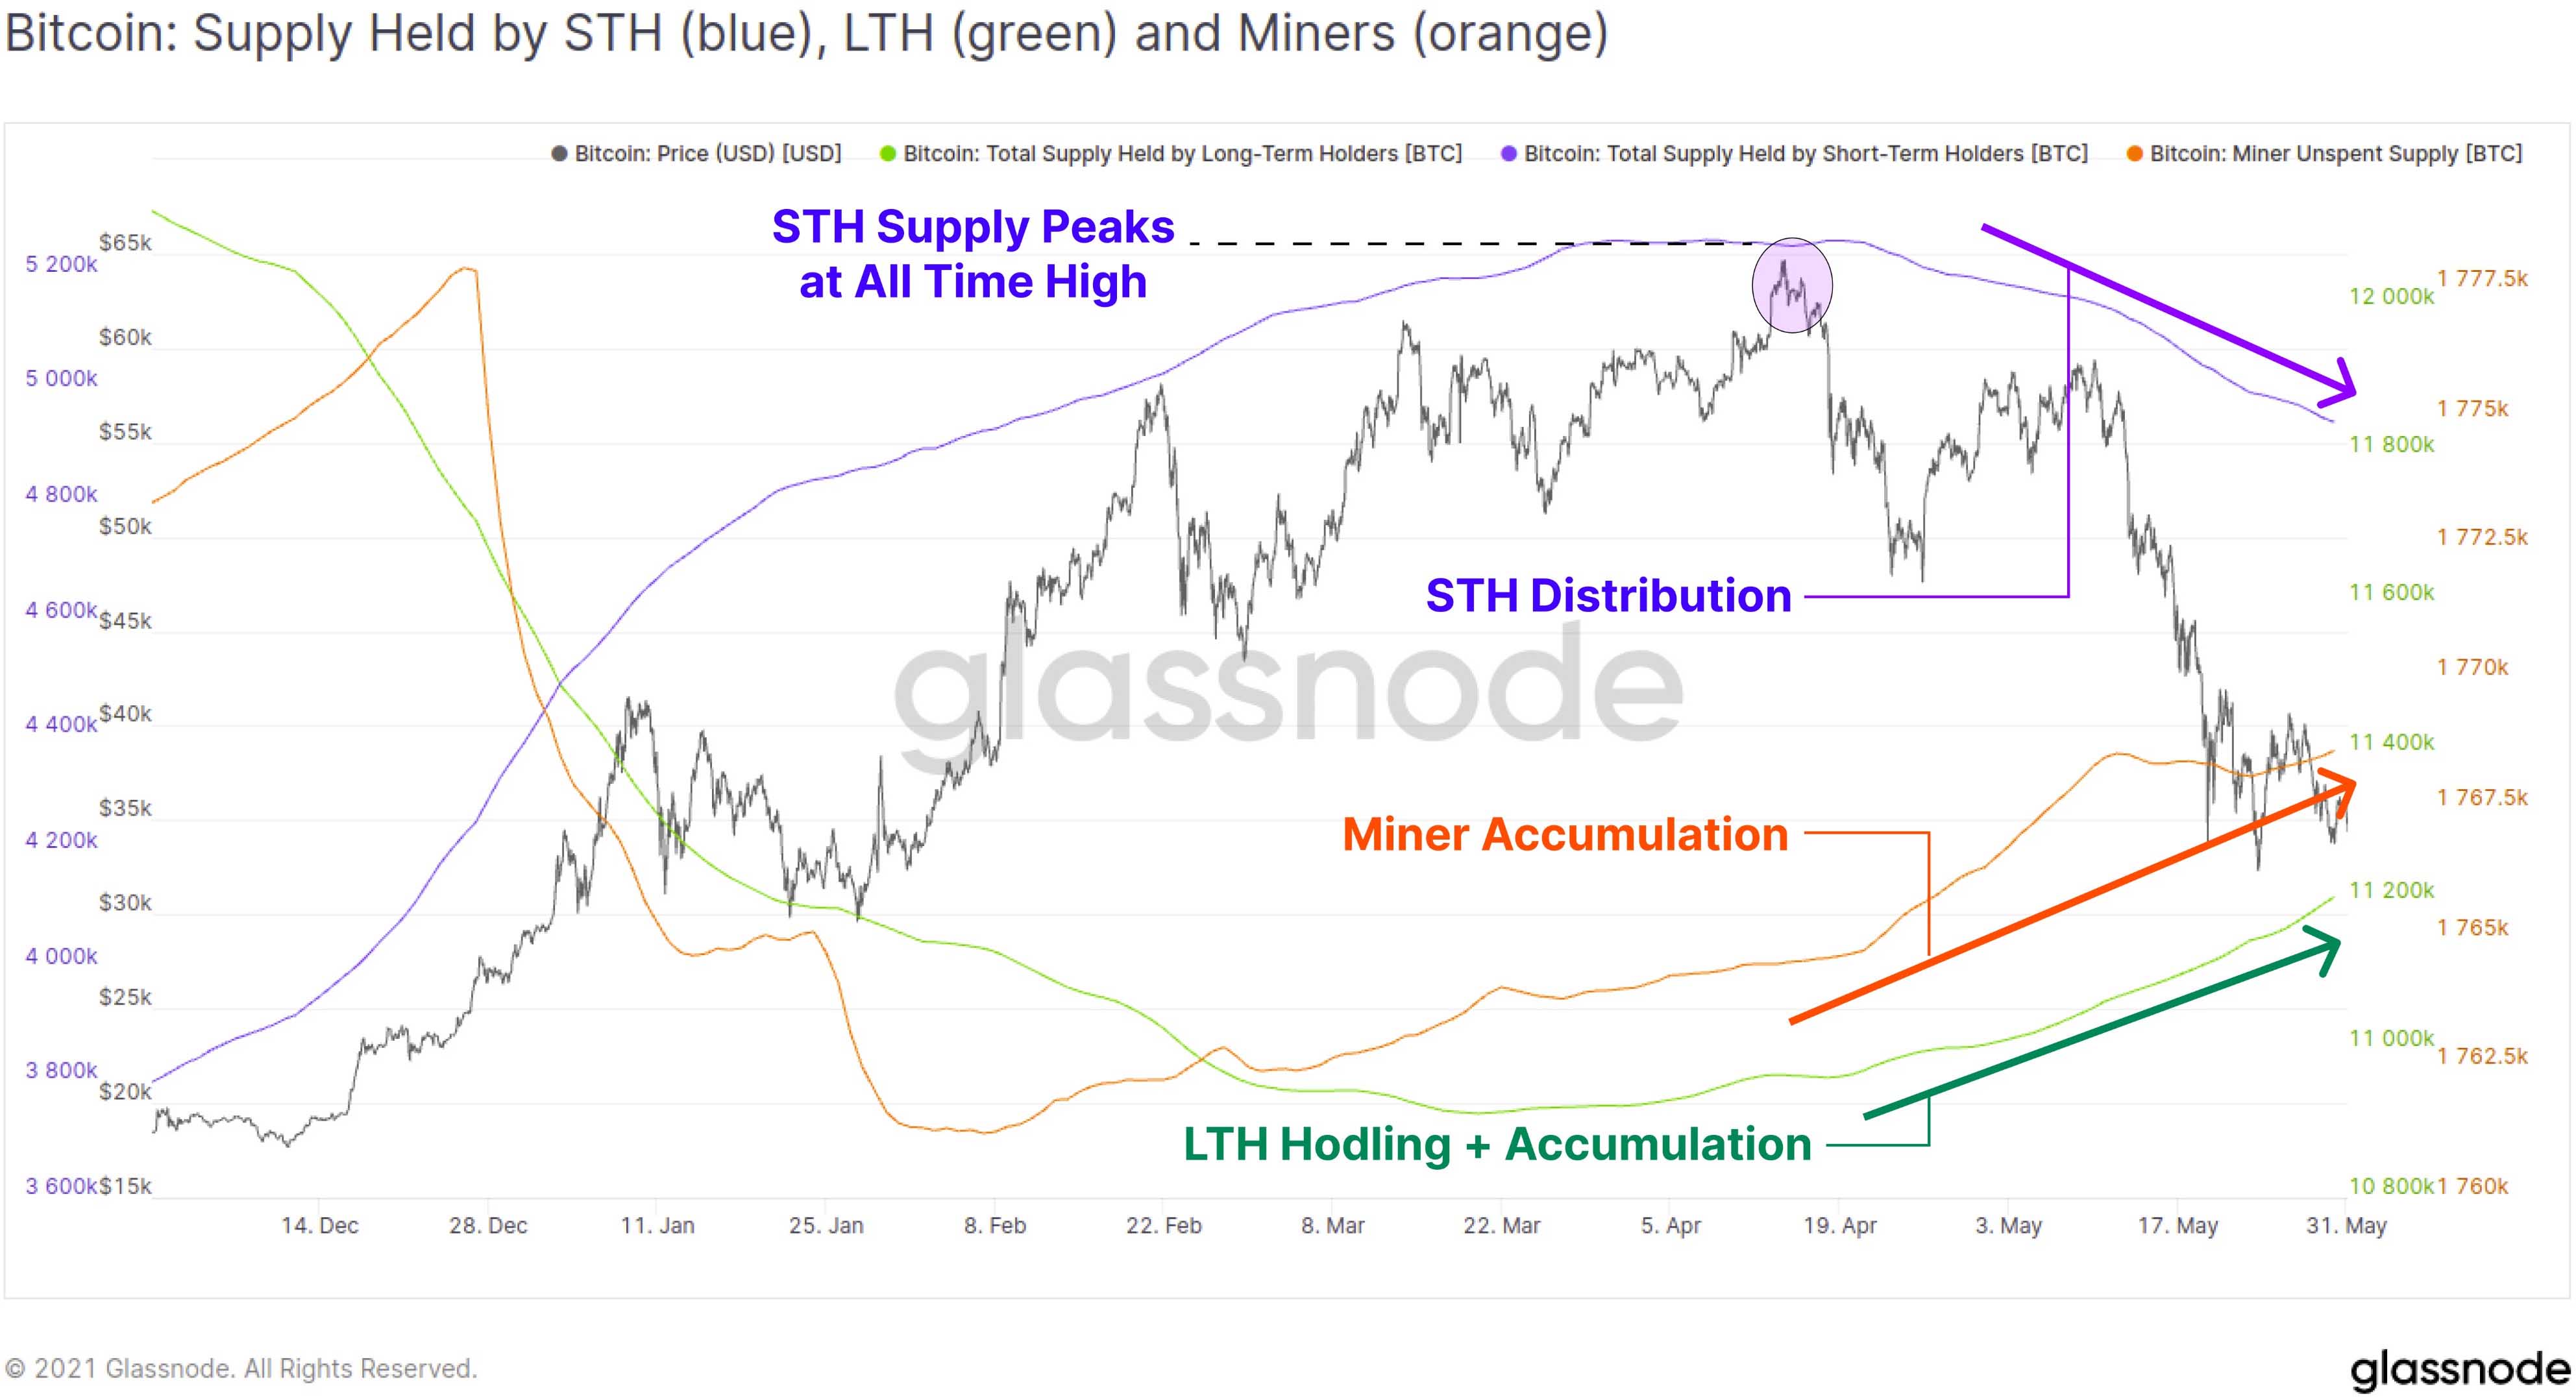
Bitcoin accumulation vs. BTC/USD annotated chart. Source: Glassnode/ Twitter
“This chart is INSANE!” popular Twitter account Lark Davis responded, highlighting the sense of excitement among longtime market participants.
“Miners and long term holders accumulating, only short term holders selling. Nothing new under the sun!”
Bitcoin’s weekly relative strength index (RSI), a key metric for divining overbought and oversold territory, is also circling lows which have only been beaten by the March 2020 crash and the $3,100 capitulation in December 2018.
Key price averages cause headaches for bulls
In terms of bull or bear, there are “lines in the sand” for traders which Bitcoin still needs to preserve to retain its bull market crown.
In its latest market update, trading suite Decentrader highlighted the 200-day moving average (DMA) and 20-week moving average (WMA) as significant levels to watch.
The 200 DMA currently sits at just above $40,000 — the place at which BTC/USD saw rejection last week — while the 20 WMA is higher at near $49,000.
“Should Bitcoin find sufficient demand in the low 30s, the 20 WMA would be expected to act as resistance,” Decentrader summarized.
“A drop lower would likely make the low $20s or the 78.6% retracement a likely target. As such, price action over the next week particularly important.”
The idea that Bitcoin could return to its 2017 high of $20,000 is unpopular for many, including PlanB, the creator of the stock-to-flow-based (S2F) price models.
While acknowledging that his models were still being “tested” by price swings, the idea of a fresh capitulation down to $20,000 is not something he considers likely.
“Of course I disagree, S2F and on-chain point to much higher prices ($100-288K). Time will tell,” he said during Twitter discourses last week.
He added that Bitcoin’s “realized price” — a calculation of BTC/USD based on the price at which each coin last moved — is now $23,000. During the 2013 and 2017 bull runs, realized price shot up by an order of magnitude, and this year is yet to copy them.
“At $23K we have some way to go IMO,” he commented alongside a chart showing realized price against the 200 WMA.

Bitcoin realized price vs. BTC/USD vs. months to halving events. Source: PlanB/ Twitter
Funding rates soothe concerns
For some counterpoint, an example of the hidden bullishness which may serve to characterize near-term price action lies in exchange funding rates.
Currently healthily negative, these suggest that it’s very much a case of shorts paying longs under current circumstances.
“Open interest has failed to recover with leverage participants being largely wiped out in the sell off and not re-entering. Funding has also remained low / negative which further echo’s the market,” Decentrader added.
As Cointelegraph reported, the capitulation of leveraged bets during the $30,000 sell-off has effectively reset market composition as traders avoid taking risks.
This should allow more organic price growth fuelled by genuine demand from those more likely to hodl BTC for the long term rather than as a short-term speculative bet.
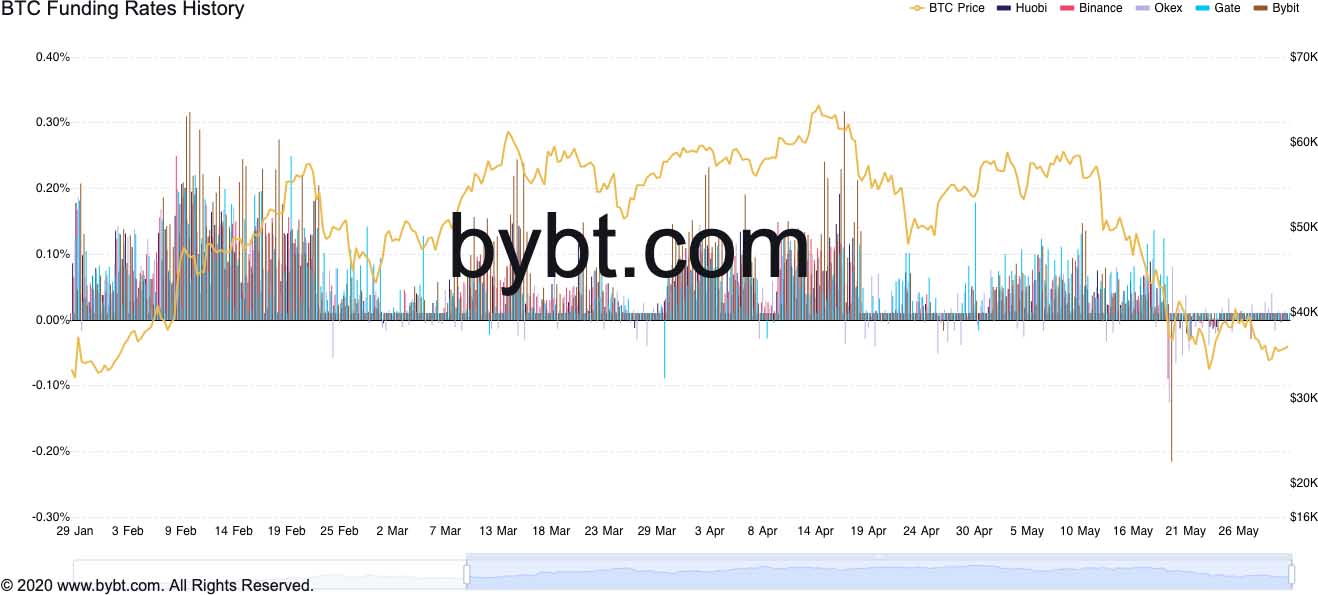
Bitcoin funding rates chart. Source: Bybt
Worst May ever?
Is this the worst May ever? In terms of monthly returns for Bitcoiners, it definitely looks like it.
On the last day of May 2021, the mood is likely anything but positive, as monthly losses for hodlers total almost 40%.
By comparison, May tends to be a lucrative month for BTC/USD — in 2017 and 2019, for instance, the pair gained more than 50% in May.
2018 was an outlier with 19% losses, but even these pale in comparison to this year. May 2021 is currently on track to be the worst month since 2013 in terms of both Q1 and Q2 performance.
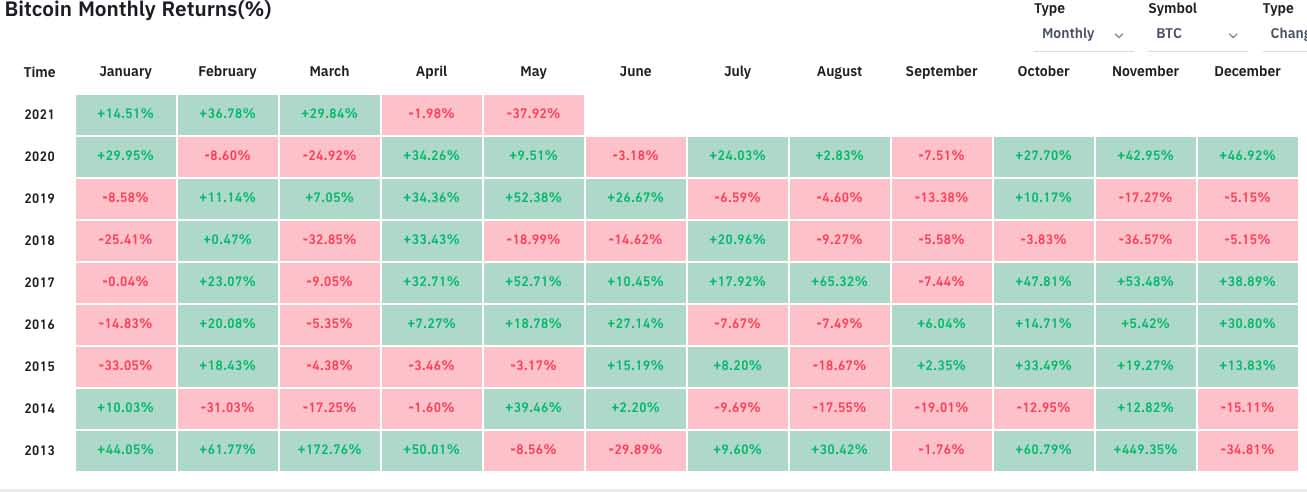
Bitcoin monthly returns percentage. Source: Bybt.com
And yet, doom and gloom are far from everywhere. Beyond Bitcoin, altcoin markets are showing signs of life, led by a continued rebound for XRP, up 13% on the day.
As traders note, volumes for largest altcoin Ether (ETH) in particular are promising, and contrast bear market behavior which tends to see little trading activity.
“We shouldn't bother too much about a weaker BTC as it might follow the stronger alt/usd pairs or continue its chop/sideways while alts go up,” trader Cypto Ed concluded.
Author

Cointelegraph Team
Cointelegraph
We are privileged enough to work with the best and brightest in Bitcoin.


