Why Bitcoin could trade sideways for two months before crypto winter ends for BTC
- Bitcoin bear market is similar to 2018 and experts believe an optimistic estimate envisages sideways price action for two months.
- BTC could begin the next bull market after that but a pessimistic estimate suggests an eight-month period of sideways movement.
- Analysts consider the $17,600 level key to Bitcoin’s uptrend and set a target of $20,000 for the asset.

Bitcoin bear market in the current cycle is similar to the BTC trend in the crypto winter of 2018. Experts have noted these similarities and shared an optimistic prediction of a bullish breakout post two months; a pessimistic outlook would imply eight months of sideways price action in Bitcoin.
Also read: Bitcoin attracts mega whales with new moves, finds support at the $16,800 level
Bitcoin price could trade sideways for two months before a breakout
Bitcoin, the asset with the largest market capitalization is currently in a long-term downtrend on its monthly chart. Jiang Zhuoer, CEO and co-founder of Bitcoin mining pool BTC.TOP notes that starting from the previous Bitcoin (BTC) all-time high (ATH) and ending with the next halving, BTC crossed the bear market bottom in 2014 and 2018, respectively.
Zhuoer argues that If Bitcoin's price hit the floor in 2022, and the FTX event caused the price to reach $15,476, then all three bear markets took similar amounts of time from the previous ATH to the bottom. The 4-year halving leading to the 4-year cycle law still appears to be relevant.
Based on market sentiment observations, this is the last bear market bottom sideways period. Events like the bankruptcy of the Digital Currency Group have already been priced in and would no longer have a significant impact on the price.
An optimistic estimate therefore suggests that the current bear market and the 2018 bear market are similar, and Bitcoin price may go sideways for another two months before the next bull run in BTC.
Zhuoer believes that a pessimistic estimate points at an eight month period of sideways movement before a recovery in BTC, similar to the 2014 bear market.
Why analysts consider $17,600 key to Bitcoin’s price rally?
CryptoGodJohn, a crypto analyst and trader considers the $17,600 level key to Bitcoin price. If BTC flips the $17,600 level, bulls will be able to target the $20,000 level. The expert believes that failure to break above $17,600 could lead to an invalidation of his bullish thesis and see BTC price revisiting $15,500.
$17,600 is most important level for me for $BTC
— Johnny (@CryptoGodJohn) January 9, 2023
Flip $17,600 I wouldn’t be surprised to see a move towards $20k
Reject likely revisit $15.5
Where is Bitcoin price headed?
Bitcoin price is in an ascending channel and on track to break above the upper trend line. If it does so and accelerates its uptrend it could rally to a target at the 61.8% Fibonacci extension of the height of the channel, at $17,369. Bulls might even target the $17,448 level. Such a breakout from a rising channel higher is often indicative of ‘irrational exuberance’ however, and may foreshadow an exhaustion peak blow-out move, before a reversal an steep decline, so traders should act with caution.
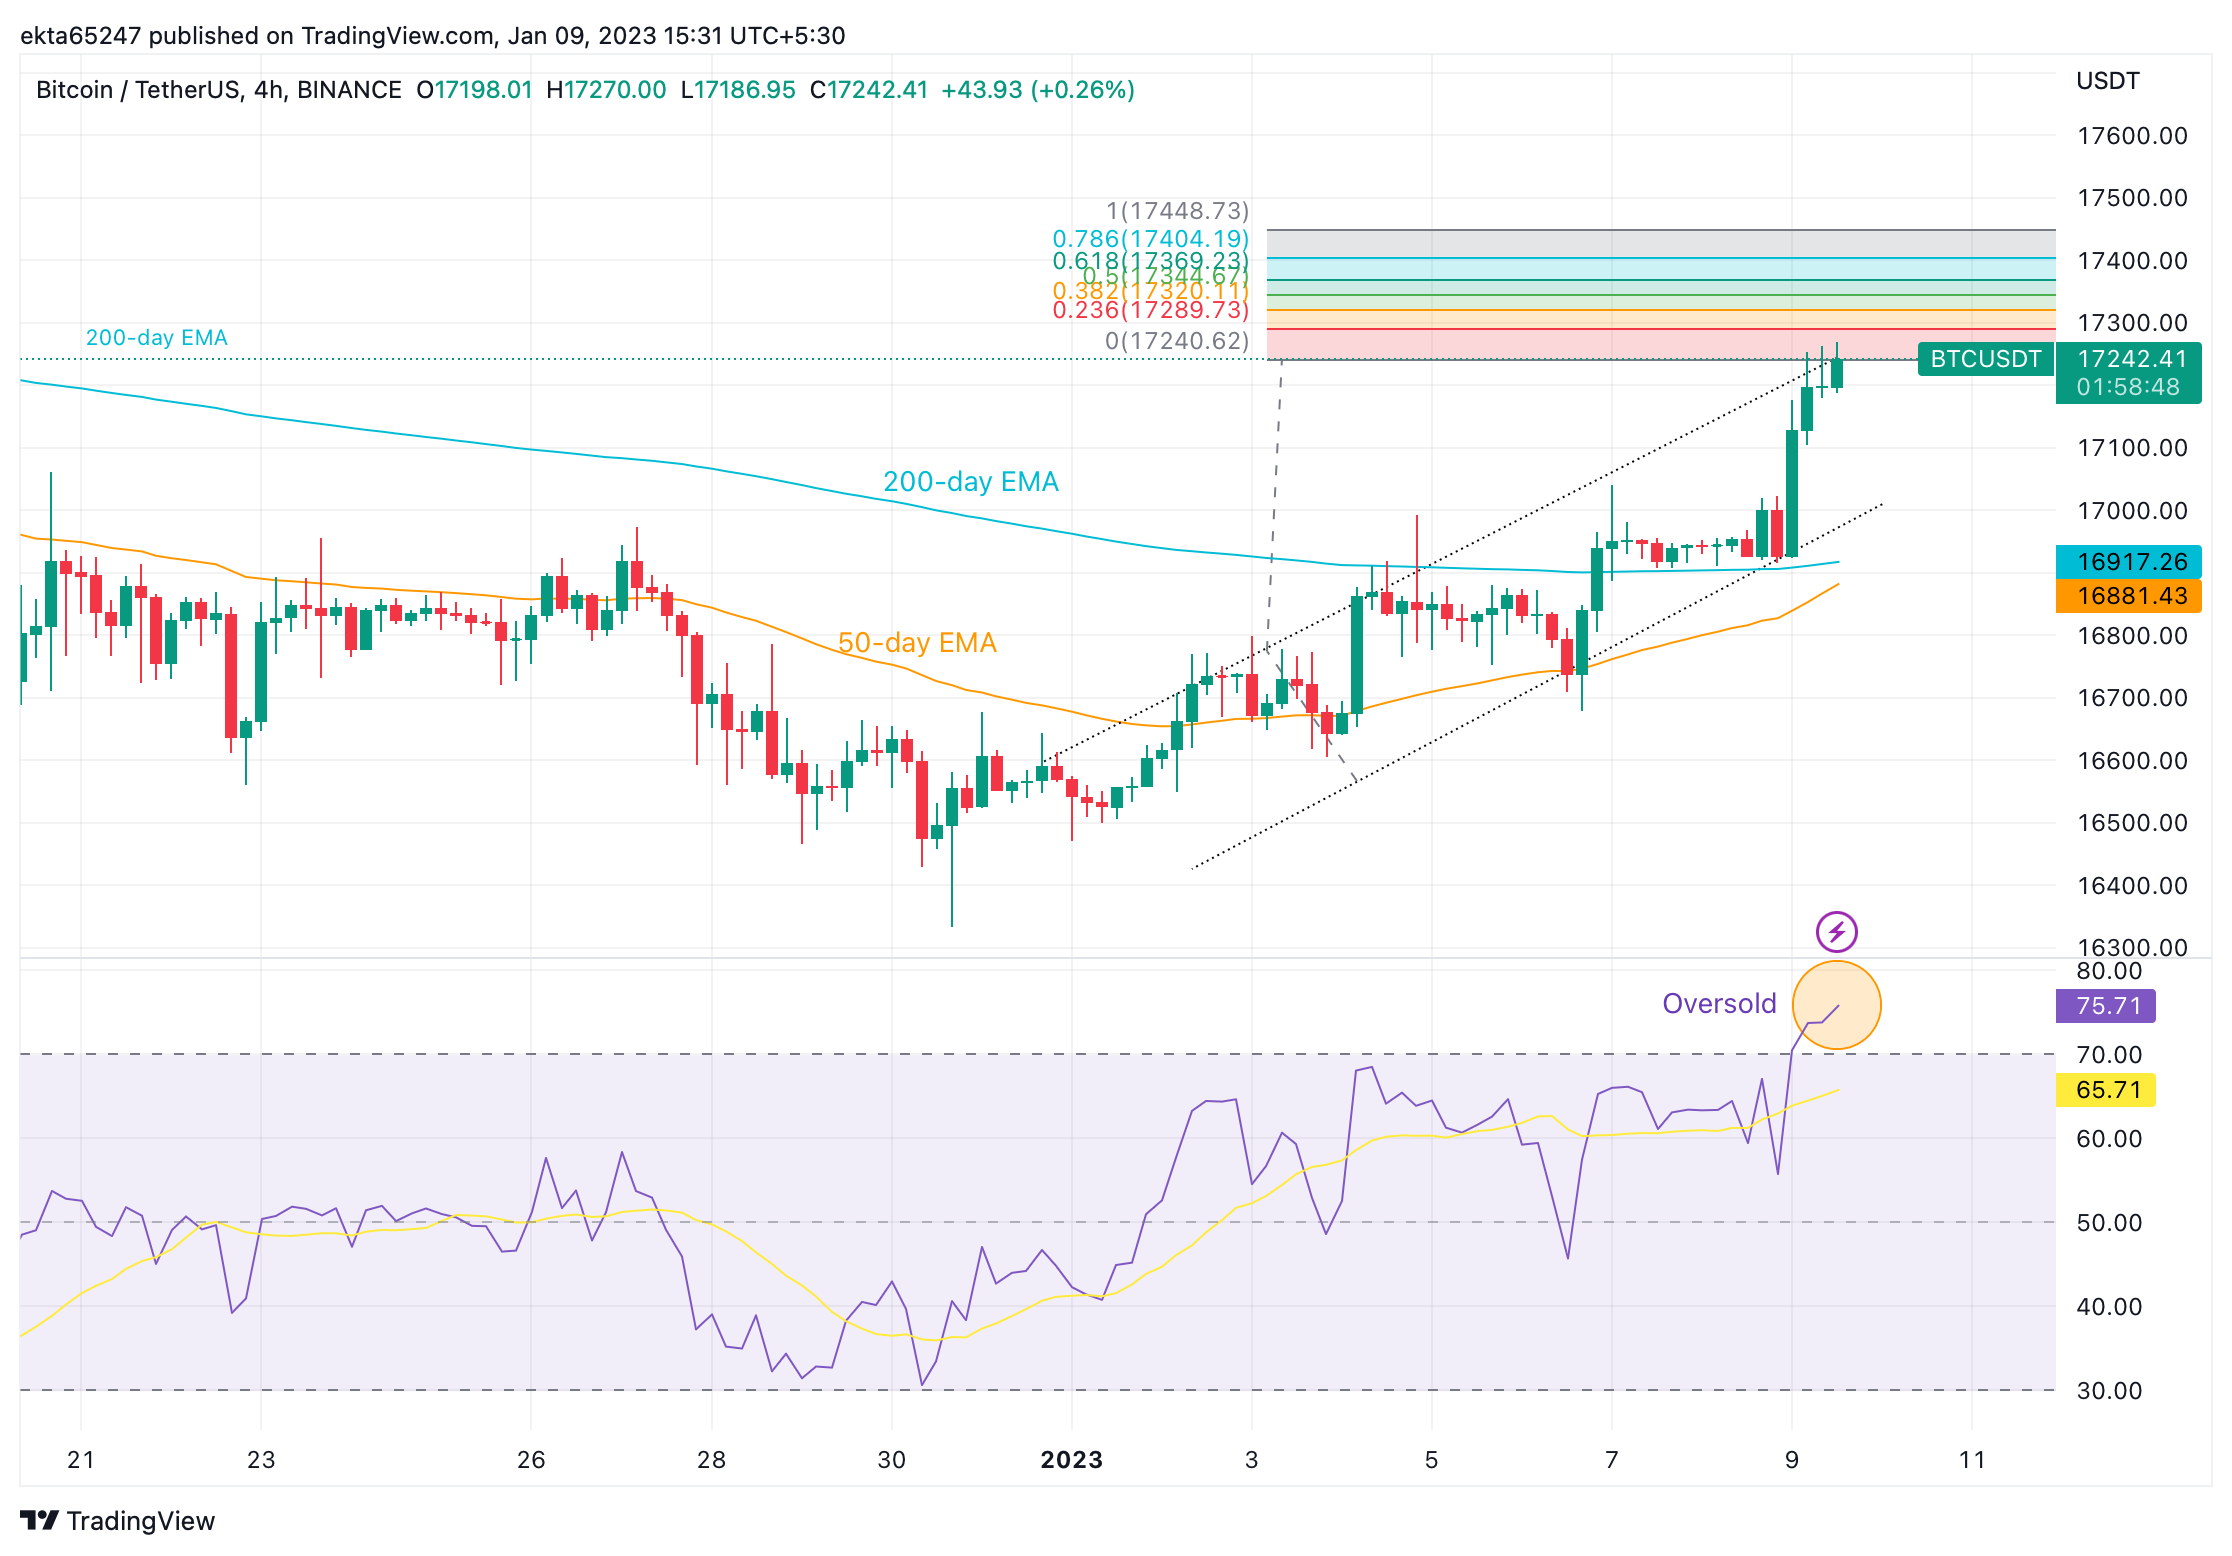
BTC/USDT price chart
Based on the chart above, the asset has climbed above the 200-day and 50-day Exponential Moving Averages, which is also a bullish sign. The Relative Strength Index (RSI) momentum indicator, however, currently reads 75.71 signifying Bitcoin is overbought. This indicates bulls should forebear from adding further longs to their positions. When the RSI drops back below 70 and reenters neutral territory, however, it will be a sign for traders to exit their long positions and consider opening shorts instead.
A decline below the lower trendline of the ascending channel would invalidate the bullish thesis altogether and suggest deeper losses to come.
Author

Ekta Mourya
FXStreet
Ekta Mourya has extensive experience in fundamental and on-chain analysis, particularly focused on impact of macroeconomics and central bank policies on cryptocurrencies.


