Which on-chain records did Bitcoin set in October — And what do they mean?

Bitcoin (BTC) went through three weeks in October, and its overall performance appears to diverge from its historically positive trend. However, on-chain data shows several encouraging signs that could form a foundation for stronger momentum this quarter.
What exactly are those on-chain indicators? And can they help Bitcoin overcome October’s bearish tone? Here is a detailed breakdown.
Bitcoin exchange reserves hit a new all-time low
Although the price of Bitcoin (BTC) dropped more than 10% in October, this decline did not lead investors to deposit their BTC onto exchanges for selling. In fact, the reserves of BTC on exchanges continued to decrease, reaching new historical lows.
According to data from CryptoQuant, only about 2.4 million BTC remain on exchanges. Over the past month, investors have withdrawn more than 200,000 BTC, and since the beginning of the year, roughly 500,000 BTC have left exchanges.
-1760697506833-1760697506837.png)
Bitcoin Exchange Reserve. Source: CryptoQuant.
The chart shows a steeper decline during Q3, reflecting an accelerating pace of withdrawals. This trend indicates stronger long-term confidence among investors. It also suggests increasing scarcity on exchanges, a condition that historically supports price growth.
Chairman Lee, an analyst at CryptoQuant, explained that the steady drop in reserves stems from institutional accumulation and the expansion of ETF custody holdings. He also noted that a similar decline in exchange reserves occurred before the major bull run in 2020, implying the potential for another rally.
“Bitcoin’s exchange reserves dropping to multi-year lows indicate a supply-side shock in progress. While short-term volatility may persist, the long-term structure shows accumulation rather than distribution. This supply contraction could serve as a foundation for the next expansion phase, similar to the 2020 setup,” Chairman Lee said.
Whale activity on exchanges surges
The Bitcoin Exchange Whale Ratio measures the share of the top 10 inflows relative to total exchange inflows. A higher ratio means whales are moving significant volumes through exchanges.
CryptoQuant data shows that this ratio's 30-day SMA has been rising steadily since May and reached its highest level of the year in early October.
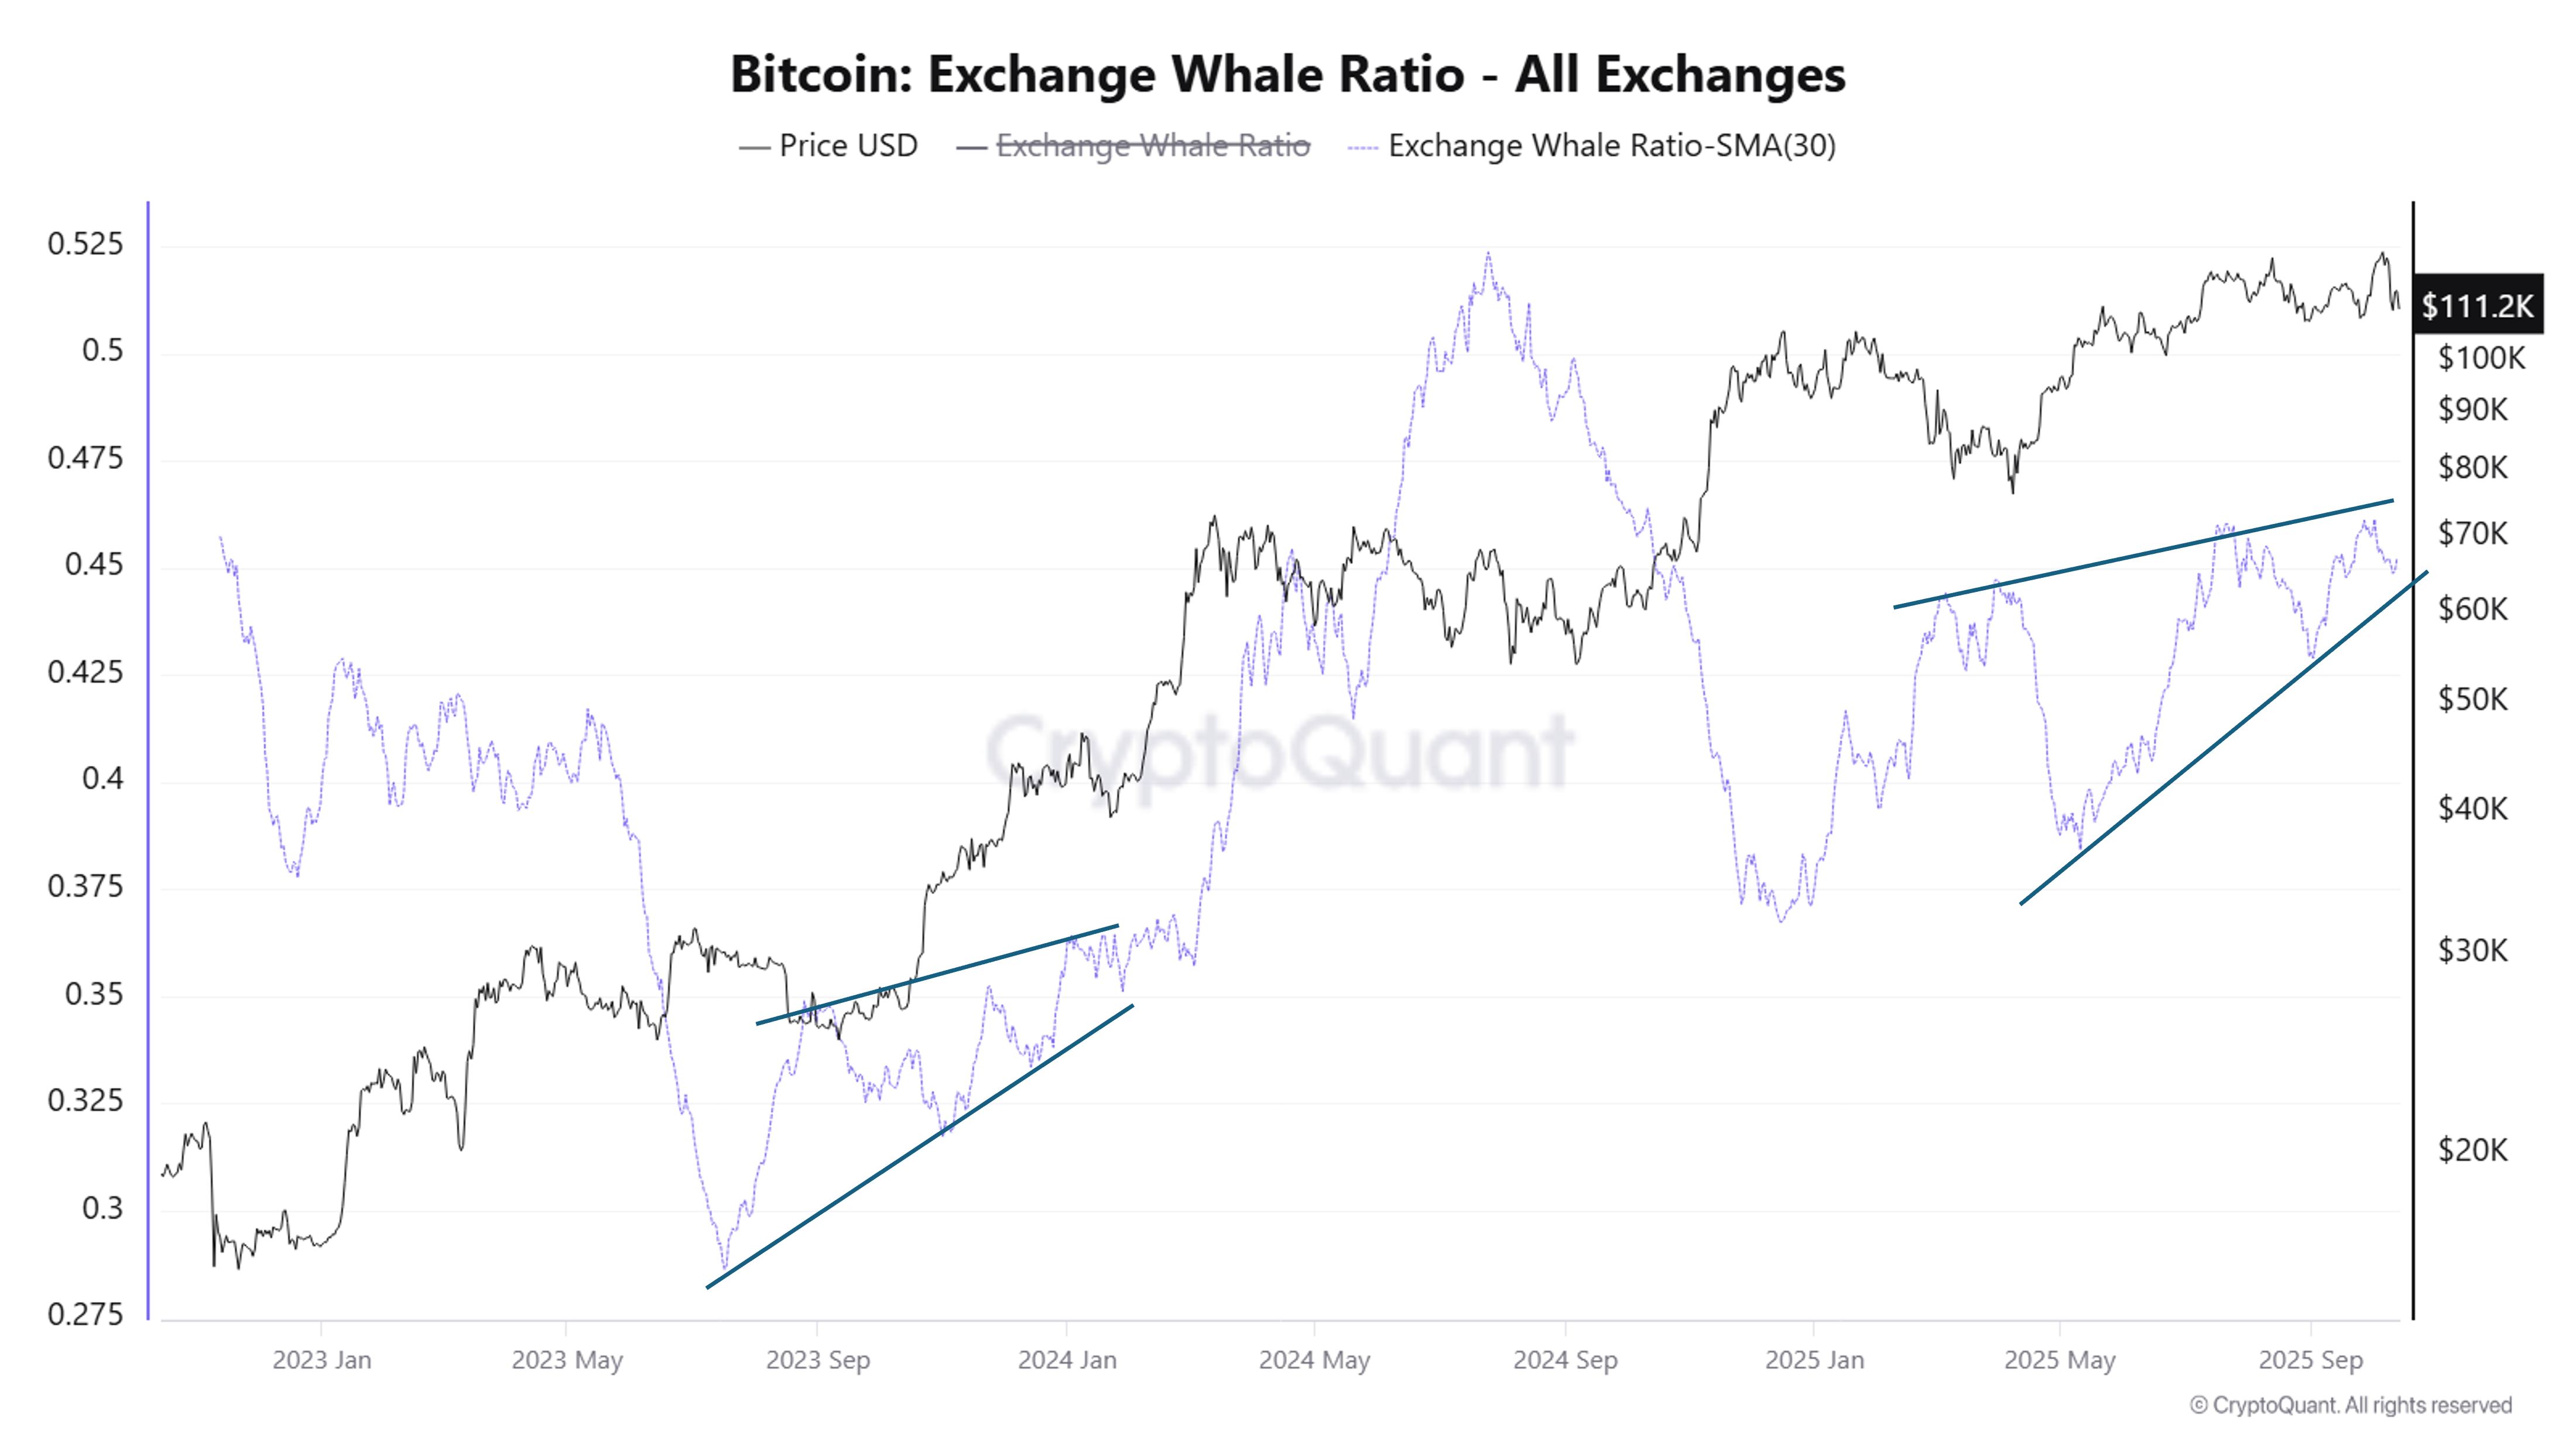
Bitcoin Exchange Whale Ratio. Source: CryptoQuant.
What stands out is that the indicator’s current pattern closely resembles what occurred in the final quarter of 2023. The ratio has been climbing in an ascending wedge formation, signaling increasingly active whale participation on exchanges.
This ratio amplifies the scarcity effect when combined with falling exchange reserves. In other words, large trading volumes amid a limited supply can intensify upward price momentum.
Therefore, the recent rise in this indicator may foreshadow a bullish phase similar to the one that began in early 2024.
On-chain transfer volume returns to yearly highs
According to the latest Glassnode report, Bitcoin’s on-chain transaction volume surged last month, surpassing $15 billion — one of the year's highest levels.
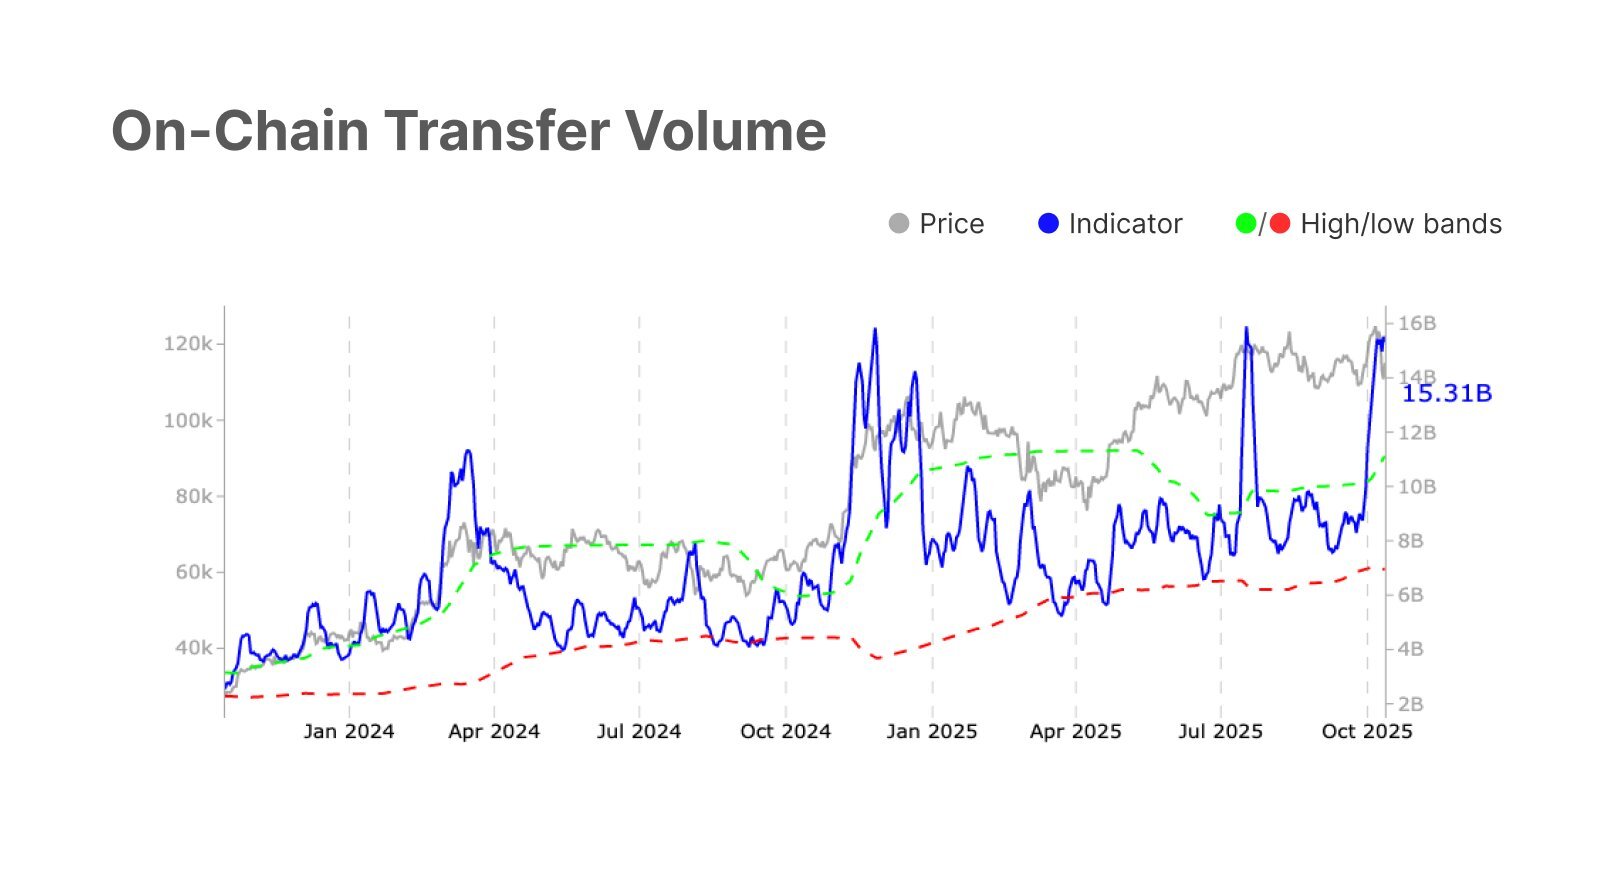
Bitcoin On-chain Transfer Volume. Source: Glassnode.
“The elevated flows point to strong capital movement and investor activity, signaling robust network engagement and heightened market participation,” Glassnode reported.
However, when comparing this data with Bitcoin’s price, spikes in on-chain activity often coincide with short-term corrections. Yet, prices have typically rebounded over the following months alongside continued increases in on-chain volume.
This supports the view that Bitcoin’s rally might pause in October but could resume with renewed strength soon.
Author

BeInCrypto
BeInCrypto
Since 2018, BeInCrypto has grown into a leading global crypto news platform. Through our award-winning journalism and close ties with industry leaders, we deliver trusted insights into Web3, AI, and digital assets.


