What Ripple holders can expect next week as XRP price coils up for explosive move to this level
- XRP price has been struggling to overcome the $0.380 to $0.400 zone for more than nine months.
- The three-day chart shows that the remittance token is at a pivotal point that could trigger a massive rally.
- Invalidation of this bullish idea will occur if Ripple bears shatter the $0.336 support floor.

XRP price shows a clear struggle between the buyers and sellers or the lack thereof. As a result, the remittance token has been in a multi-month consolidation. Additionally, the relisting of Ripple on the US-based crypto exchange Coinbase, as mentioned by Paul Grewal, the platform’s Chief Legal Officer, adds credibility to the bullish thesis that is detailed below.
Read more: Will Coinbase to relist XRP?
XRP price set to climb higher
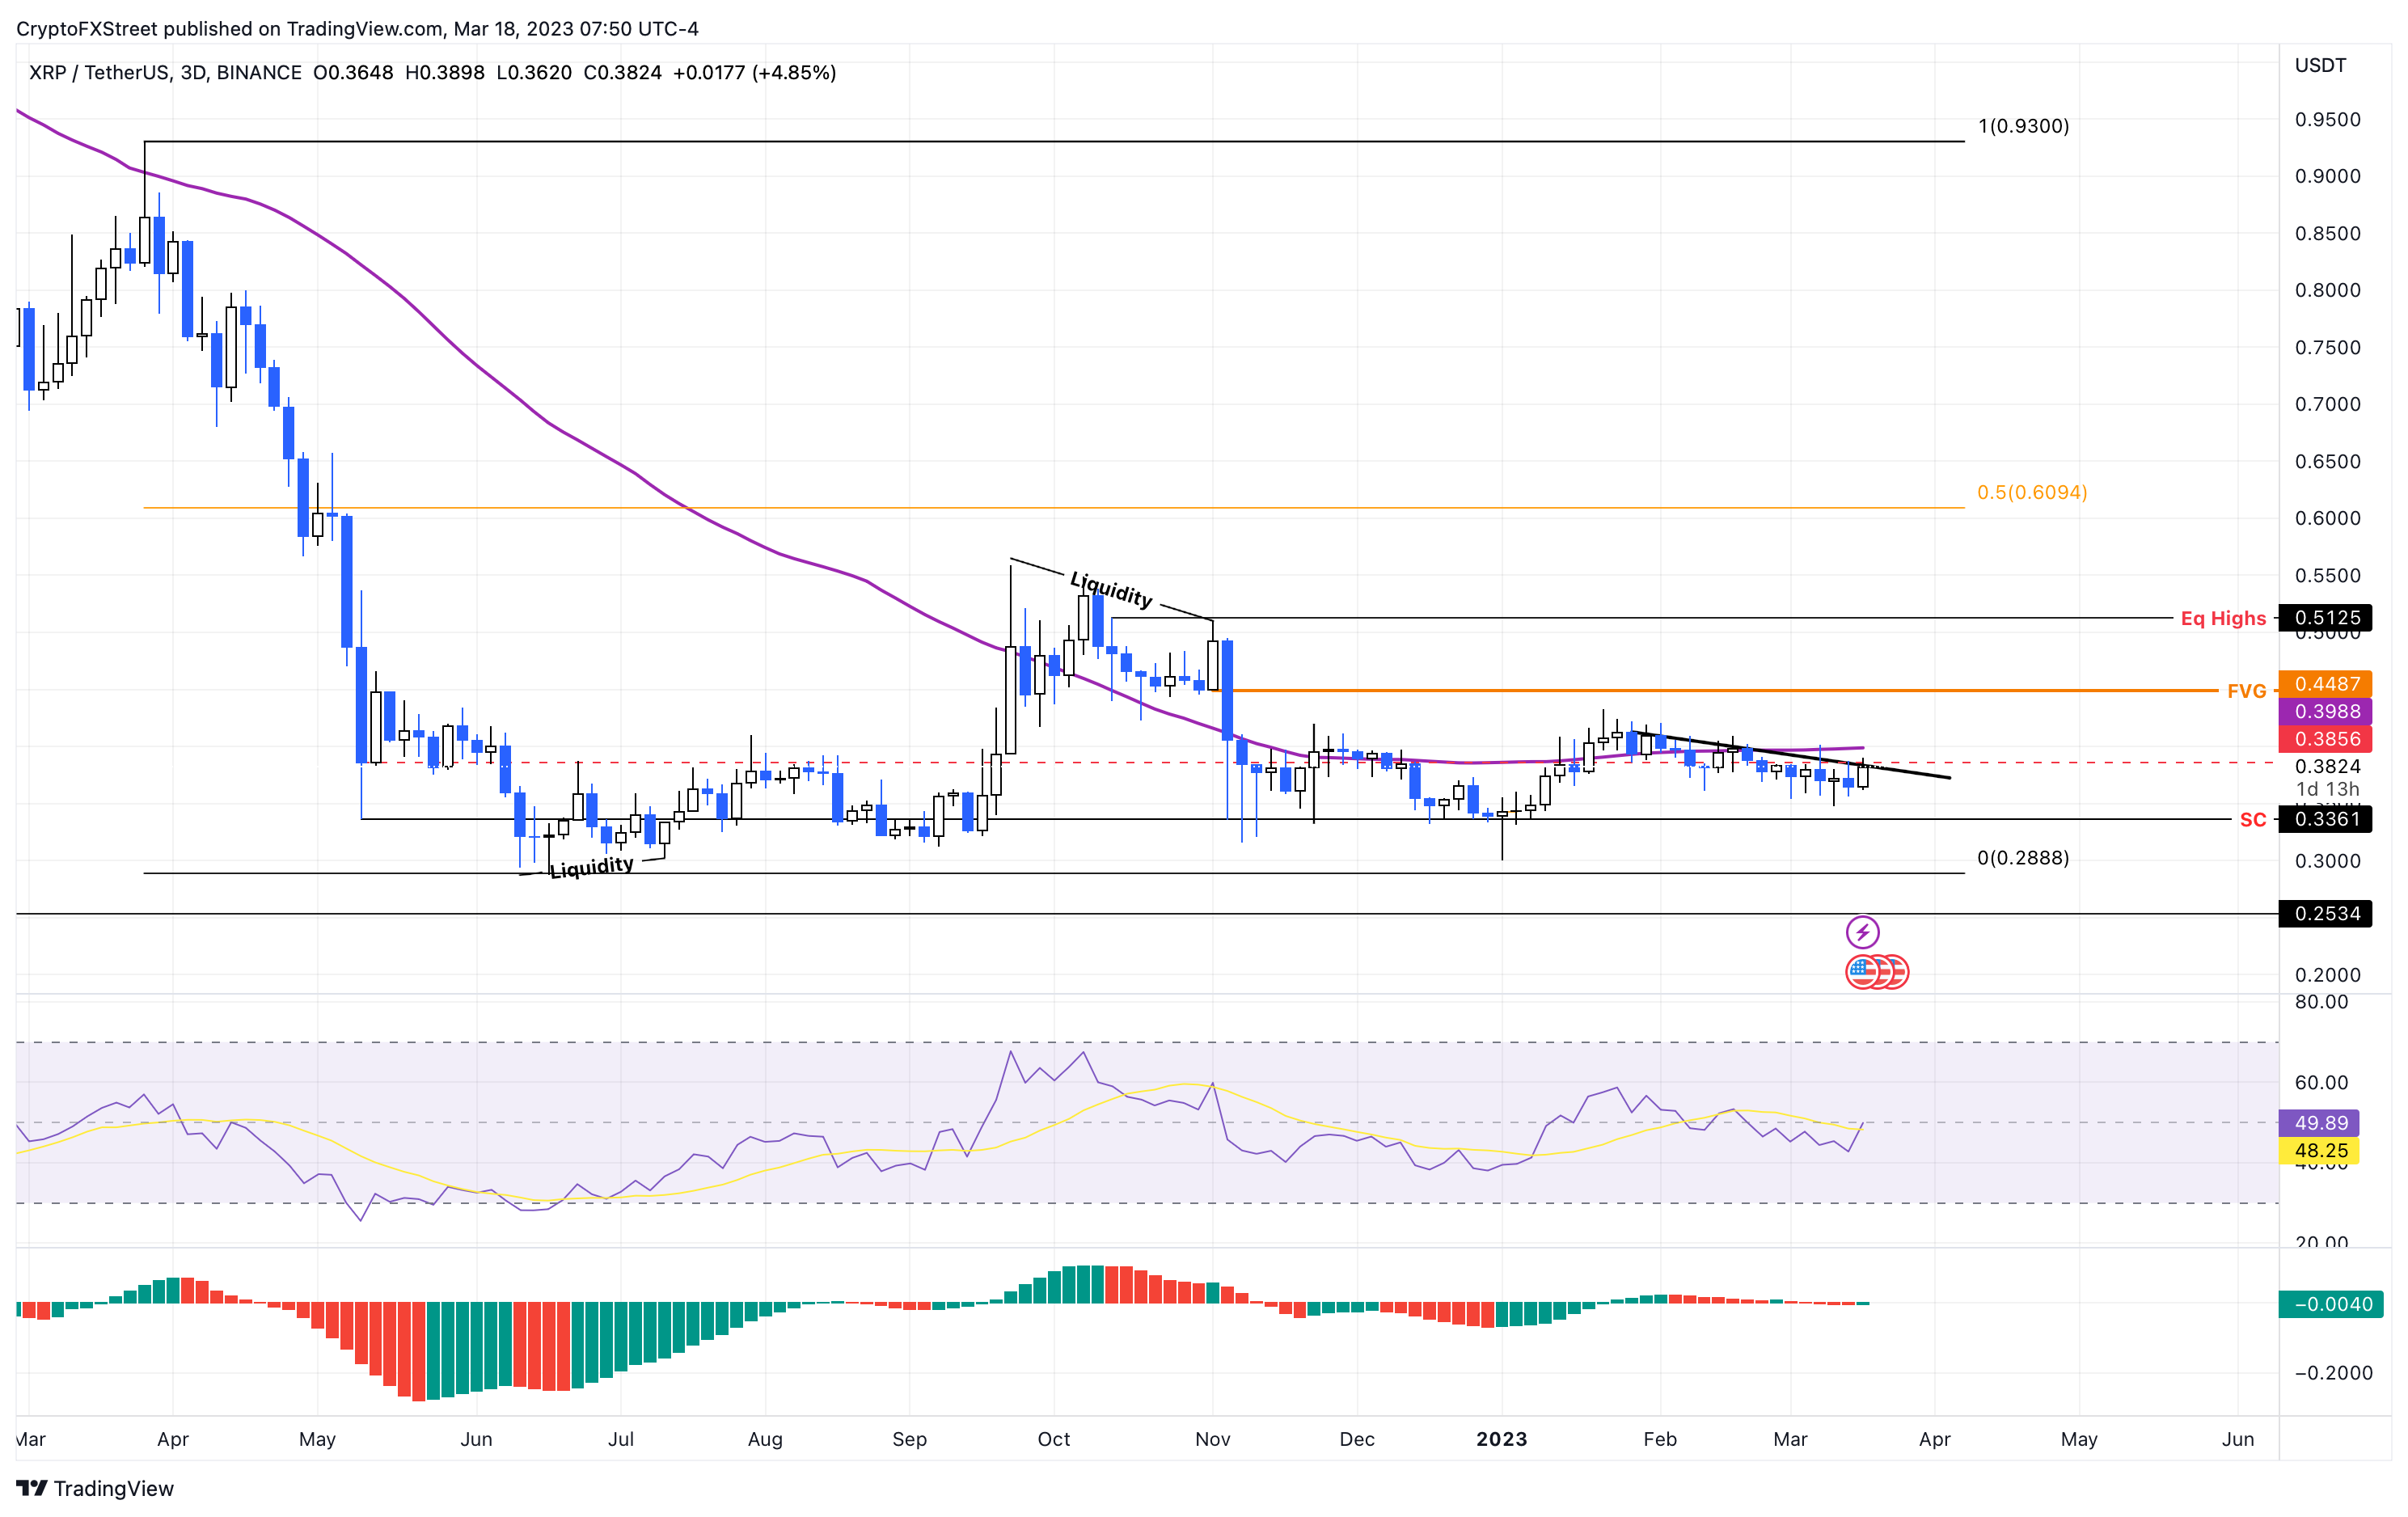
XRP price has been stuck in a downtrend since January 22 and has shed 11% to where it currently trades - $0.383. The remittance token currently auctions below the 200-day Simple Moving Average (SMA) at $0.398 and the horizontal hurdle at $0.385.
This zone between $0.383 and $0.389 is crucial in determining the directional bias for Ripple in the coming days.
The Relative Strength Index (RSI) and the Awesome Oscillator (AO) are two key indicators that will help in understanding the strength of a bullish breakout, should it occur.
The RSI indicator is struggling around the midpoint at 50 without sliding down to the oversold zone. This consolidation below the median reveals that the bullish momentum is surplus, preventing sellers from taking over.
The AO indicator is also showing a rangebound movement below the zero line, painting the same picture as the RSI.
Both the momentum indicators are holding their own, while the XRP price is on a downtrend, which is a telltale sign of a hidden bullish divergence. This setup results in a bullish breakout. Since Ripple has been consolidating for around the $0.385 hurdle for more than nine months, a bullish breakout will have a massive tailwind to it.
The potential levels that XRP price will tag include the Fair Value Gap at $0.448 and the equal highs at $0.512. Clearing these levels without a major blow to the buying pressure could extend the northbound move to $0.609, which is the midpoint of the 68% crash witnessed between June and May 2022.
This move, in total, would constitute a 60% gain from the current level.
XRP/USDT 1-day chart
While the bullish outlook for XRP price makes logical sense, the unknown variables include the SEC vs. Ripple lawsuit that has been ongoing since December 2020.
Additionally, the banking crisis that started in March has not reached a conclusion and could topple the bullish narrative that Bitcoin set up after rallying to $27,000 over the last week.
Read More: Week Ahead: Crypto markets reel from the banking crisis as investors prepare for US CPI
If these events cause a sudden panic that results in a marketwide sell-off, it would jeopardize the outlook detailed above. More specifically, if XRP price breaks below the supply climax level at $0.336 support level, it would invalidate the bullish thesis.
In such a case, the remittance token could slide to tag the local bottom of the 68% crash between June and May 2022 crash at $0.288. A further spike in selling pressure could drive Ripple to retest the $0.253 support level
Author

Akash Girimath
FXStreet
Akash Girimath is a Mechanical Engineer interested in the chaos of the financial markets. Trying to make sense of this convoluted yet fascinating space, he switched his engineering job to become a crypto reporter and analyst.


