VeChian Elliott Wave technical analysis [Video]
![VeChian Elliott Wave technical analysis [Video]](https://editorial.fxstreet.com/images/Markets/Currencies/Cryptocurrencies/VeChain/vechain-150x150logo-637399983192838290_XtraLarge.png)
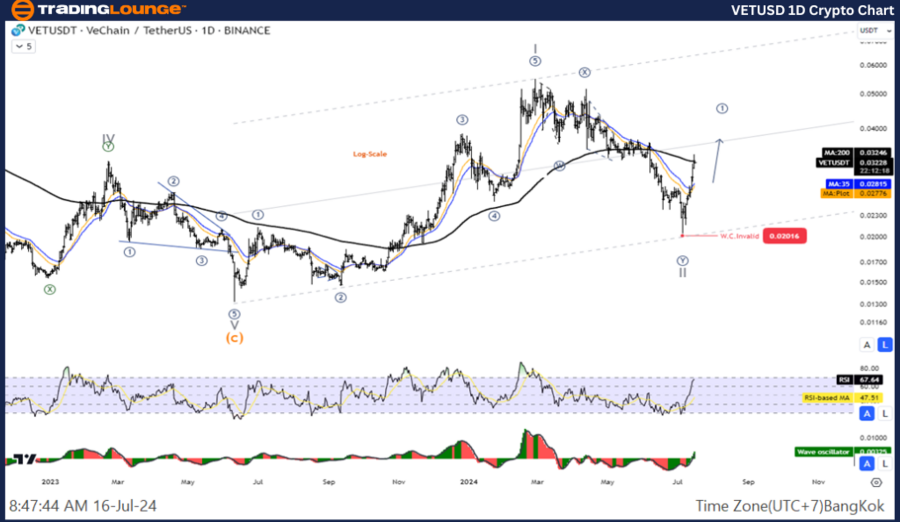
VET/USD Elliott Wave technical analysis
Function: Counter trend.
Mode: Corrective.
Structure: Double Corrective.
Position: Wave ((Y)).
Direction next higher degrees: Wave II of Impulse.
Wave cancel invalid Level: 0.2100.
Details: Wave II May is complete and the price increase again in Wave III.
VeChian / U.S. dollar(VETUSD)Trading Strategy: Overall, VeChain looks like the correction in Wave II has ended at the 0.020 level and the price is rising again in Wave III. Therefore, gold finds an opportunity to rejoin the trend from the pullback.
VeChian / U.S. dollar (VETUSD) Technical Indicators: The price is above the MA200 indicating an Uptrend, The Wave Oscillator is a Bullish Momentum.
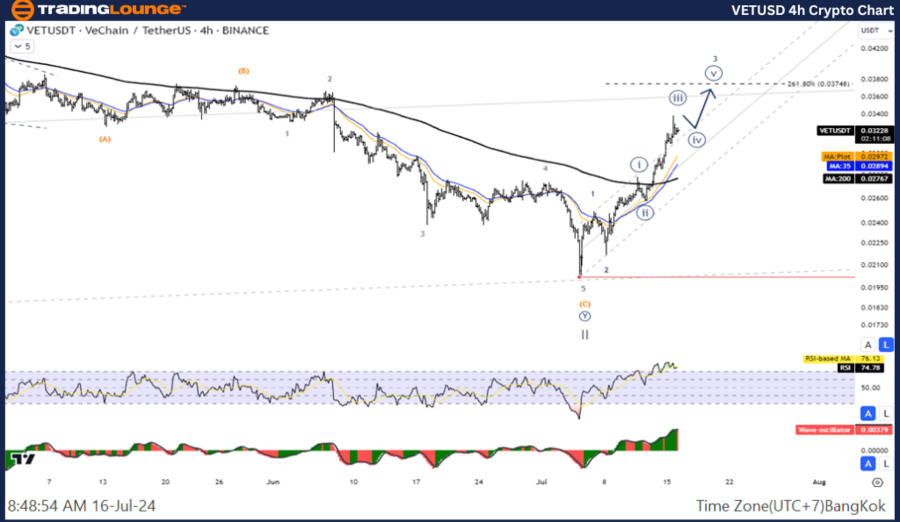
VET/USD Elliott Wave technical analysis
Function: Follow trend
Mode: Motive
Structure: Impulse
Position: Wave ((V))
Direction next higher degrees: Wave 3 of Impulse
Wave cancel invalid level: 0.2100
Details: The five-wave Increase of Wave 3
VeChian / U.S. dollar(VETUSD)Trading Strategy: Overall, VeChain looks like the correction in Wave II has ended at the 0.020 level and the price is rising again in Wave III. Therefore, gold finds an opportunity to rejoin the trend from the pullback.
VeChian / U.S. dollar(VETUSD)Technical Indicators: The price is above the MA200 indicating an Uptrend, The Wave Oscillator is a Bullish Momentum.
VeChian Elliott Wave technical analysis [Video]
Author

Peter Mathers
TradingLounge
Peter Mathers started actively trading in 1982. He began his career at Hoei and Shoin, a Japanese futures trading company.


