Vechain price targets 50% upside in the coming weeks
- VeChain price breaking free from pivotal Fibonacci extension level.
- Consecutive weekly dojis hinted at trend resumption.
- Weekly Relative Strength Index (RSI) near historical highs.

Vechain price has already climbed 22%, and momentum shows no signs of waning. The breakout above the 3.618 Fibonacci extension of the 2018-2020 bear market at $0.097 is a relief for the bullish speculators after failed attempts in the last three weeks.
VeChain price reflects increased testing of the network in China
Since November 2020, VET has religiously held the 10-week simple moving average (SMA) on a closing basis, establishing a fortified digital token trend. Unlike other pullbacks, the March correction of 25% stayed well above the key moving average and any important retracement levels of the 2020-2021 bull market.
With a resumption of the trend, traders need to focus on the 4.618 extension level of the 2018-2020 bear market at $0.124 as the first line of resistance. A more credible target is the 2.618 extension level of the March decline at $0.141, yielding a 26% gain from the current price.
More aggressive traders need to focus on the 3.618 extension of the March correction at $0.166. It is a 50% gain from the current price, but considering the magnitude of the breakout and the volume commitment, it is a reasonable projection.
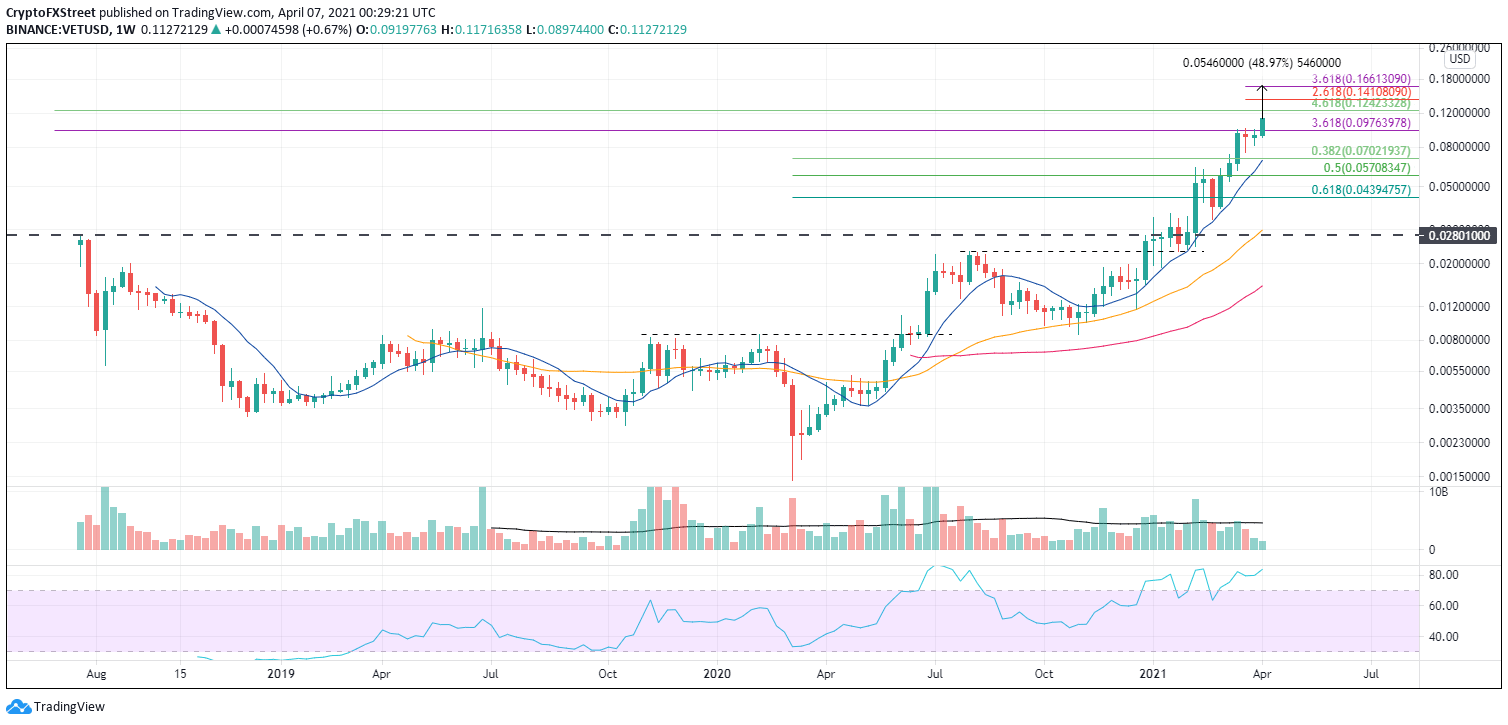
VET/USD weekly chart
Charts on multiple timeframes point to $0.097 as the critical support for the rally, and any weekly close below the level will immediately shift the outlook to neutral. The subsequent support is the March low at $0.075, followed by a combination of the 10-week SMA and the 0.382 retracement level of the 2020-2021 advance around $0.070.
If the critical moving average does not hold on a weekly close, it is a signal that the trend has changed and a far deeper correction is underway. The 0.50 retracement level sits at $0.057, and the 0.618 retracement level comes in at $0.044.
Author

Sheldon McIntyre, CMT
Independent Analyst
Sheldon has 24 years of investment experience holding various positions in companies based in the United States and Chile. His core competencies include BRIC and G-10 equity markets, swing and position trading and technical analysis.


