|

VeChain price recovers 50% of its market capitalization in hours after massive collapse

  • VeChain price has seen a massive 50% rebound from a low of $0.13.
  • The digital asset could see another upswing in the short-term according to technicals.
  • VET bulls must conquer a key resistance level to confirm an uptrend.

VeChain, like the rest of cryptocurrencies, had a major drop in the last two days and lost close to $8 billion in market capitalization, gaining around $4 billion in the last 24 hours. 

VeChain price aims for a massive rebound if key resistance level is broken

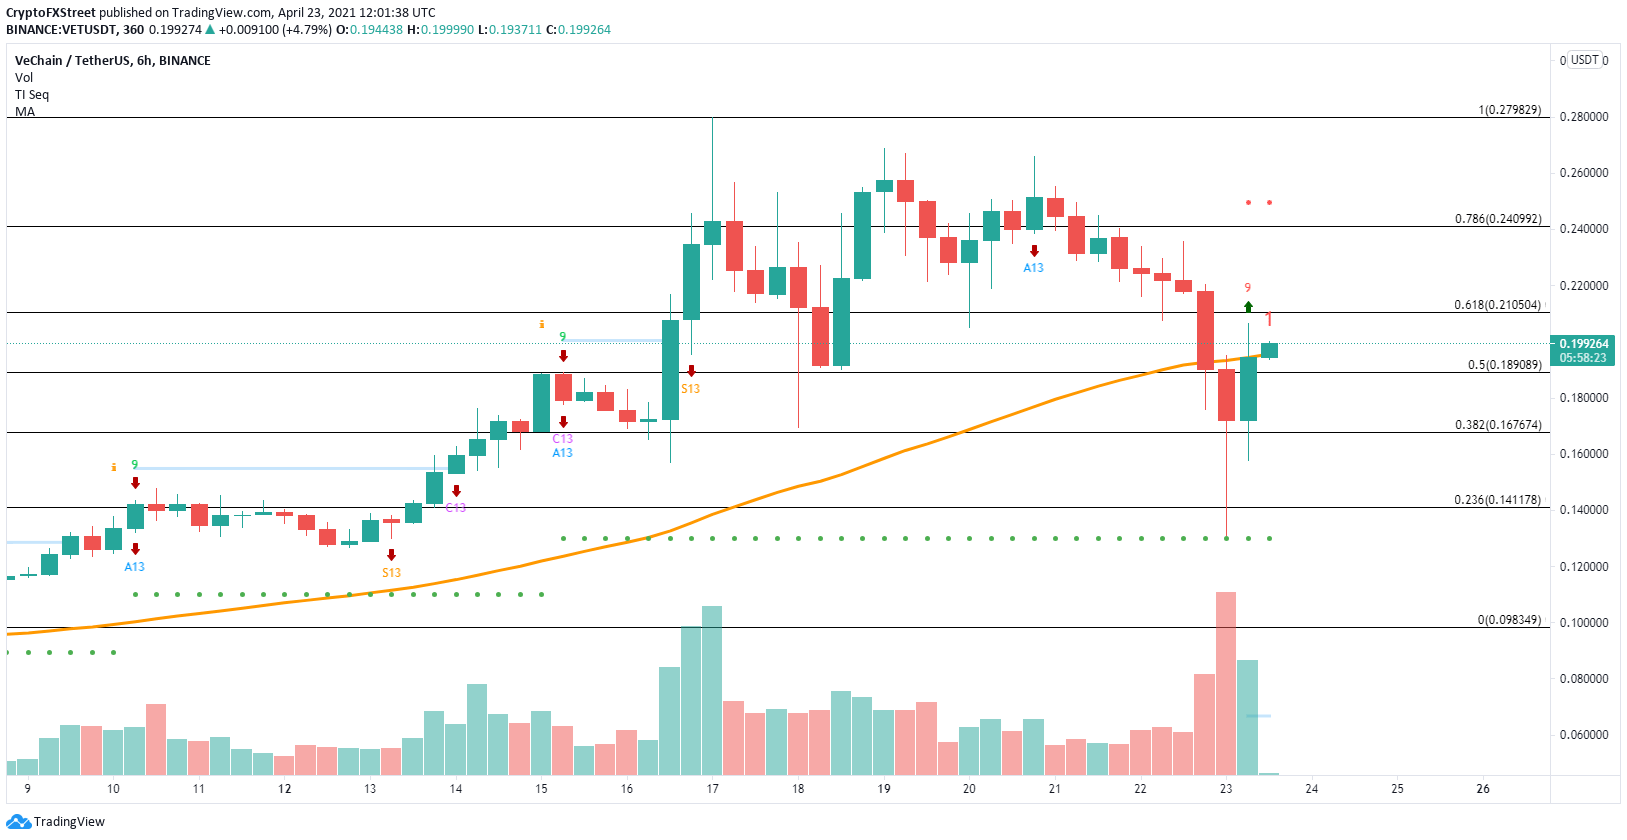
VeChain price has seen a significant rebound in the last 24 hours from its low of $0.13 to $0.194 at the time of writing. The digital asset only faces one last key resistance level at $0.195, which is the 50 SMA. 
vet price

VET/USD 6-hour chart

A 6-hour candlestick close above the 50 SMA support level will confirm a short-term uptrend. Additionally, the TD Sequential indicator has just presented a buy signal which is also increasing the buying pressure of VET.  
vet price

VET/USD 12-hour chart

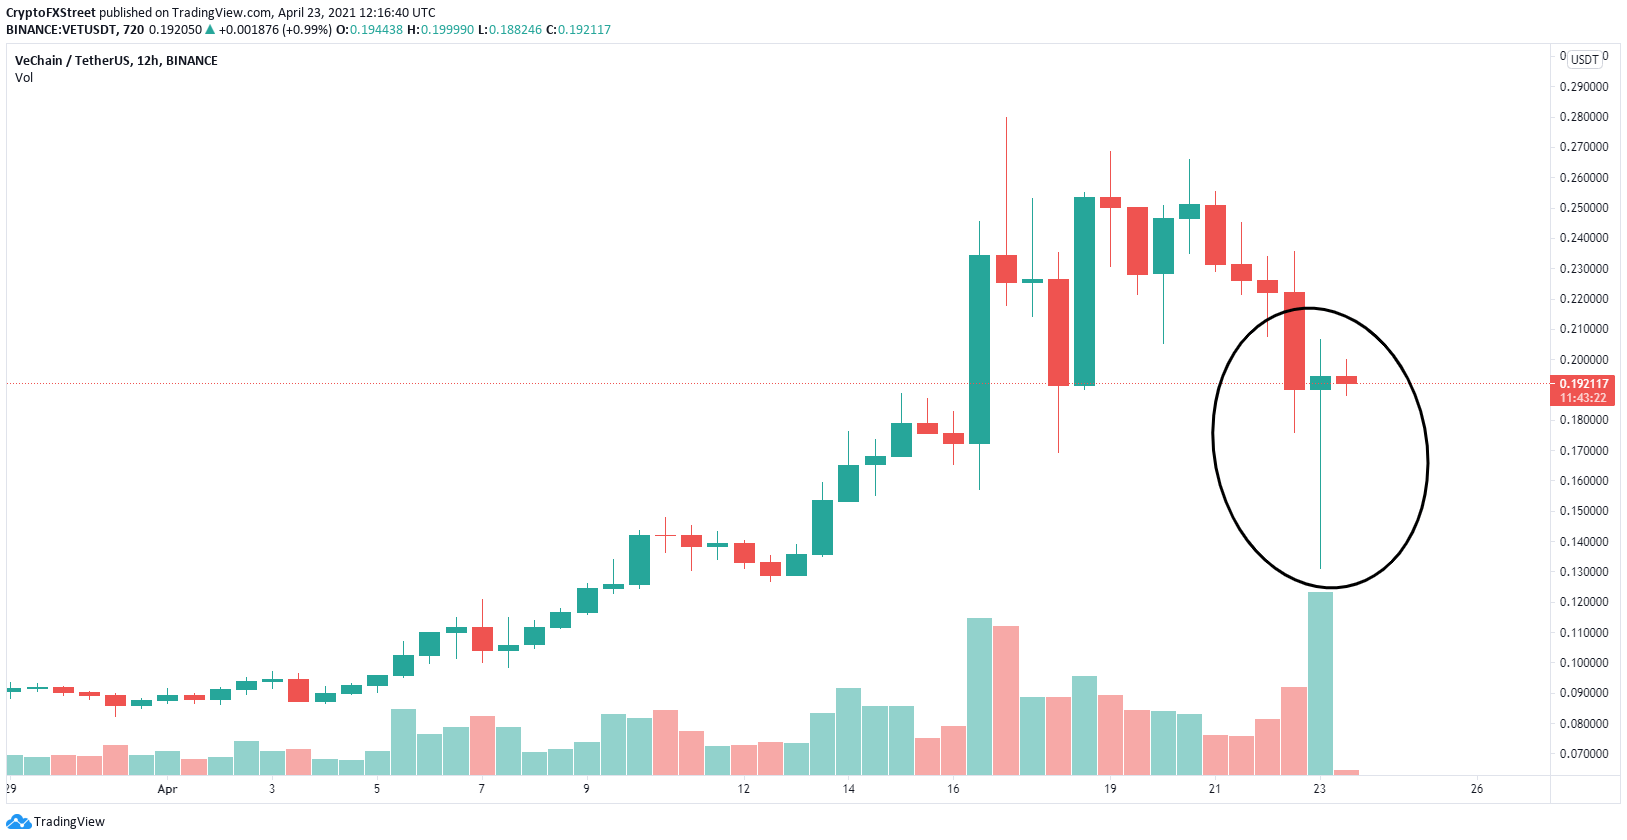
On the 12-hour chart, VeChain has formed a hammer candlestick, which is considered extremely bullish, and a reversal candlestick. It signals the asset is near a bottom, but there needs to be other factors to be confirmed, like the buy signal mentioned above.
vet price

VET/USD 4-hour chart

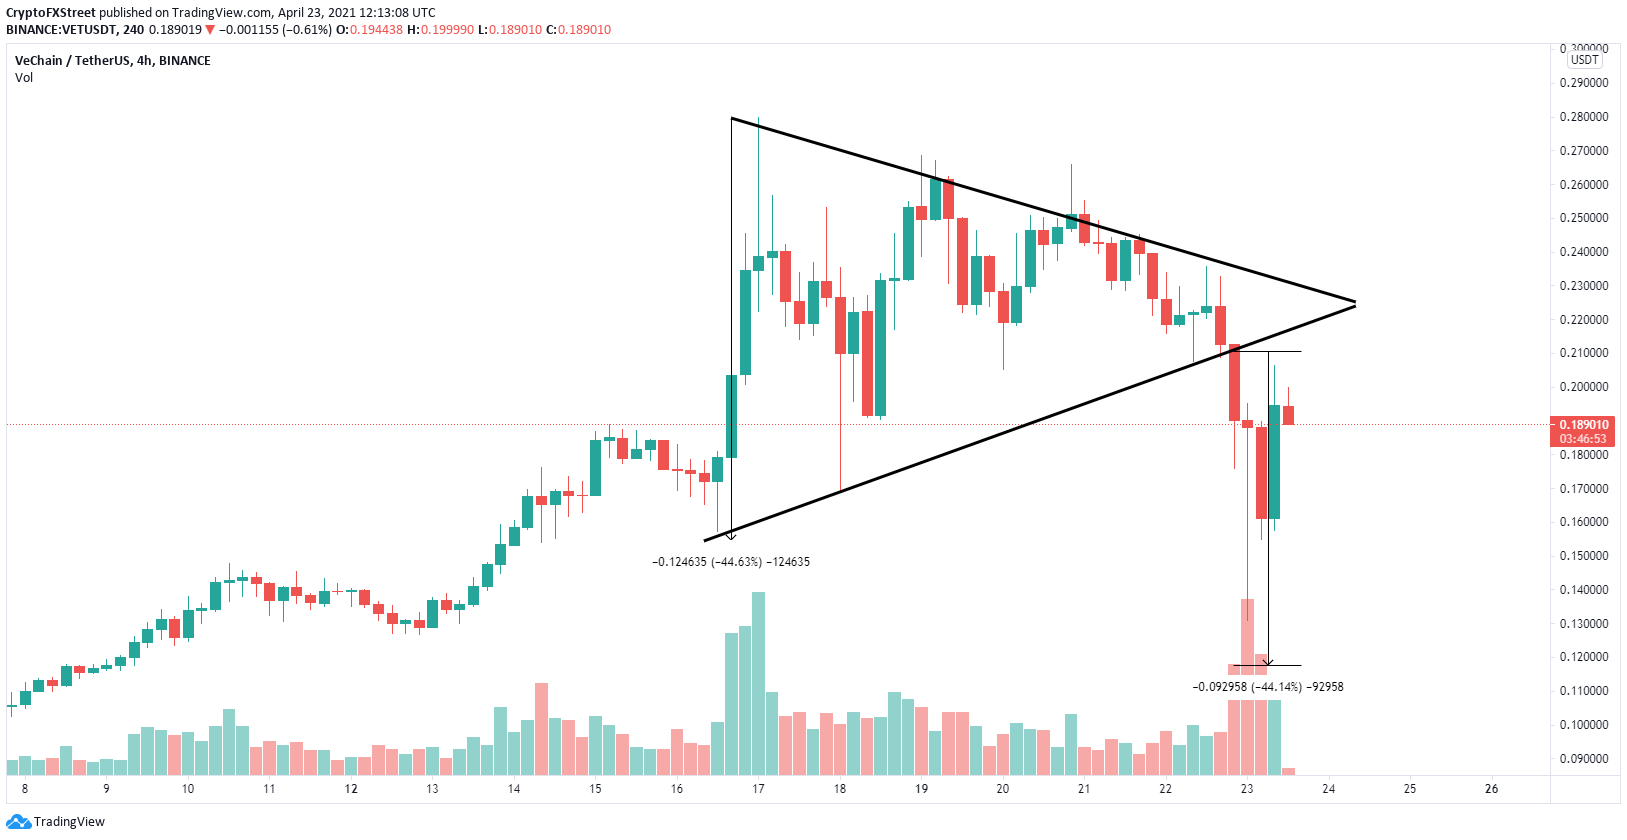
However, on the 4-hour chart, VeChain price had a breakdown from a symmetrical triangle pattern which has a long-term price target of $0.118. This was not met in the last crash and the previous support trend line will most likely act as a strong resistance level which can quickly push VeChain price down to the target of $0.118.

Author

Lorenzo Stroe

Lorenzo Stroe

Independent Analyst

Lorenzo is an experienced Technical Analyst and Content Writer who has been working in the cryptocurrency industry since 2012. He also has a passion for trading.


More from Lorenzo Stroe
Share:

Editor's Picks

Cardano Price Forecast: Weak momentum puts ADA recovery at risk

Cardano is trading below $0.222 on Thursday after failing to sustain gains above the 50-day Exponential Moving Average near $0.228 the previous day. Weakening derivatives metrics and fading bullish momentum continue to weigh on sentiment, while a break below the 100-day EMA could push ADA lower. Derivatives data shows a cautious outlook for Cardano.

Ripple and Stellar outlook: XRP and XLM recovery stalls below EMAs

Ripple and Stellar remain under pressure on Thursday as both struggle to sustain their recent recovery attempts. XRP trades below $1.36, while XLM slips beneath $0.183, as mixed derivatives metrics, weakening momentum indicators and heating market conditions suggest cautious market sentiment. Derivatives data shows weakening conditions for Ripple and Stellar.

Zcash Price Forecast: ZEC reclaims $1,300 as ETF inflow hits 30-day high

Zcash price hovers above $1,300 on Thursday, sustaining its 15% gains so far this week with three straight days of recovery. Institutional and retail appeal is returning, with over $15 million in inflows recorded on Wednesday and ZEC futures Open Interest rising to a 30-day high of $2.89 billion. The technical outlook for ZEC indicates an upside bias as recovery gains traction.

Bitcoin derivatives improve, but $87,000 sell wall looms
Bitcoin (BTC) showed signs of recovery on Wednesday as derivatives positioning improved, but sell risk grew between $86,500 and $87,500, where sell orders and leveraged liquidation clusters could limit further gains.
Bitcoin: Macroeconomic headwinds, cooling demand cap BTC gains
Bitcoin (BTC) extends losses this week, trading below $82,500 as of Friday as selling pressure continues. Weakening institutional demand supports this pullback as BTC spot Exchange-Traded Funds (ETFs) are on track to record a two-week withdrawal streak, reaching $146.19 million in net outflows through Thursday.