VeChain Price Prediction: VET sustained by healthy accumulation, aims for $0.135
- VeChain price beats the Anchored VWAP from the beginning of 2021 and the 200-day simple moving average (SMA).
- VET has rallied over 20% since triggering the double bottom pattern on August 6.
- Intra-day Relative Strength Indexes (RSI) are now showing a bearish momentum divergence.

VeChain price struggled to overcome the Anchored VWAP at $0.087 from July 26 to August 4, raising doubts about the sustainability of the rebound from the July 20 low. The 6.18% gain on August 6 broke the resistance of the indicator and triggered the double bottom pattern. The resulting VET price action has been impressive, lifting the cryptocurrency above the 200-day SMA at $0.099 and, on course, to tag the measured move price target of the double bottom.
VeChain price consolidation clears weak holders
VeChain price was contained by the Anchored VWAP for nine sessions while simultaneously holding the 50-day SMA, creating the type of consolidation that weeded out the weak holders from the initial burst higher and established the foundation for the continuation of the rally. The resulting price compression proved strategic as VET defeated the trifecta of resistance that included the Anchored VWAP at $0.087, the double bottom trigger at $0.095 and the 200-day SMA at $0.099 in a couple of days.
With VeChain price above the trifecta of resistance, VET investors should prepare for a rally continuation to the double bottom measured move price target of $0.135, which is over 21% from the current price and almost 42% from the double bottom entry price. The target closely coincides with the 38.2% Fibonacci retracement of the May-June correction at $0.133.
To rally beyond the measured move price target to the 50% retracement at $0.162 will require considerable firepower as the target is overshadowed by several highs corresponding to the late May and early June periods.
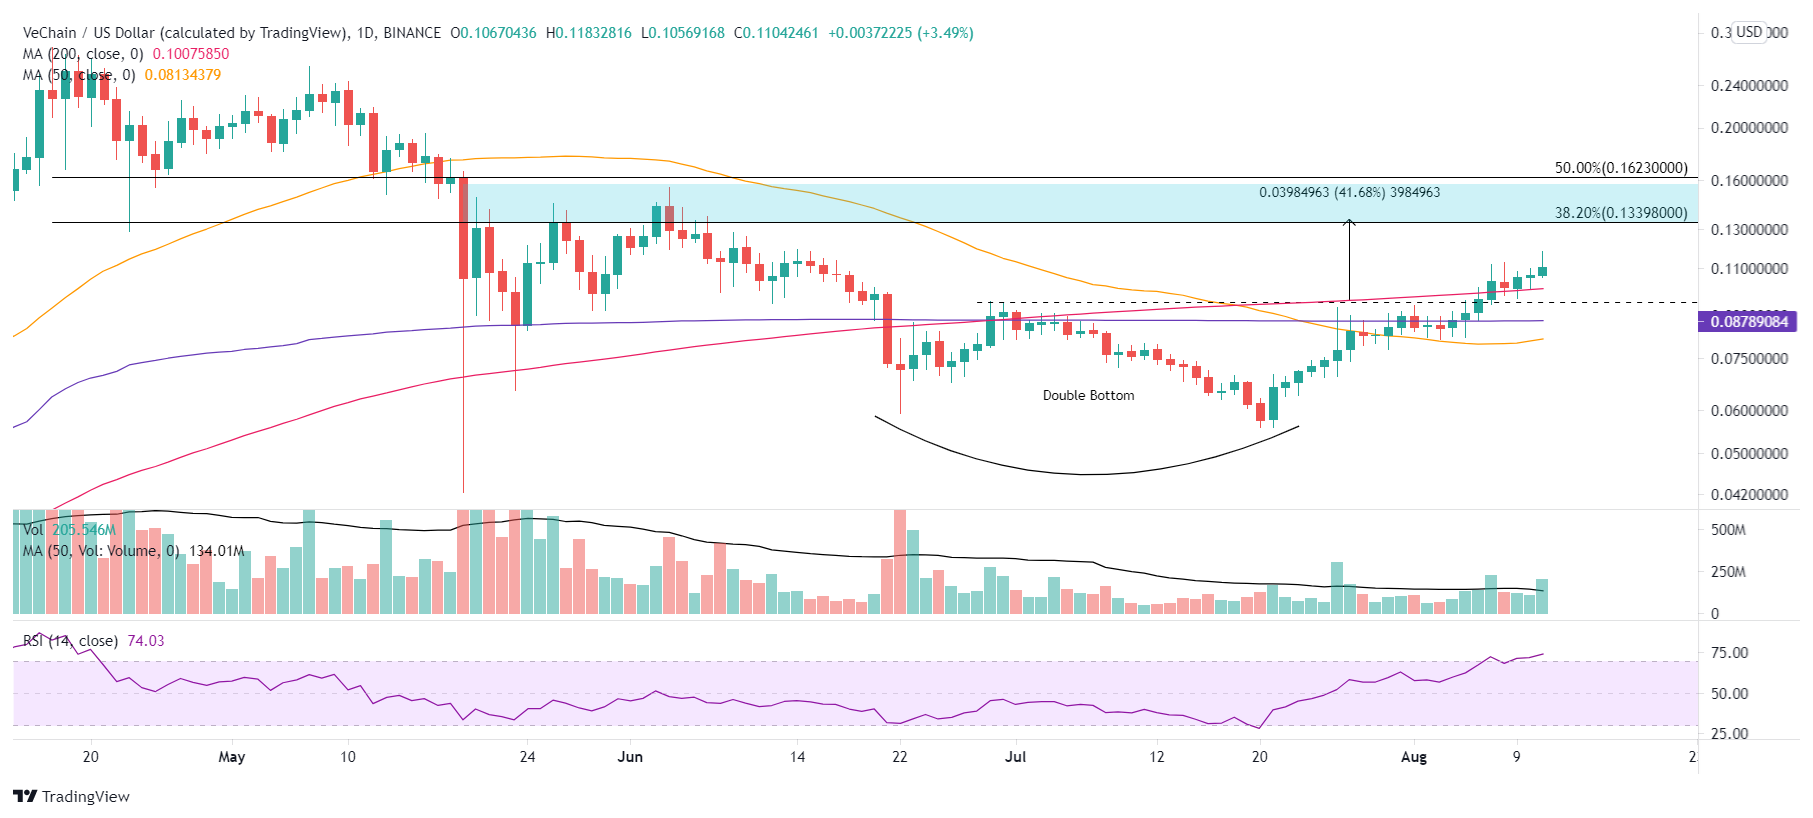
VET/USD daily chart
A negative development for VeChain price is the appearance of a bearish momentum divergence on the intra-day charts. It points to declining VET momentum over the last few days and the potential for a test of the double bottom breakout price of $0.095.
If the divergence introduces a pullback, VeChain price is well supported by the previous trifecta of resistance, ranging from $0.087 to $0.100, representing a VET pullback of 15-20%
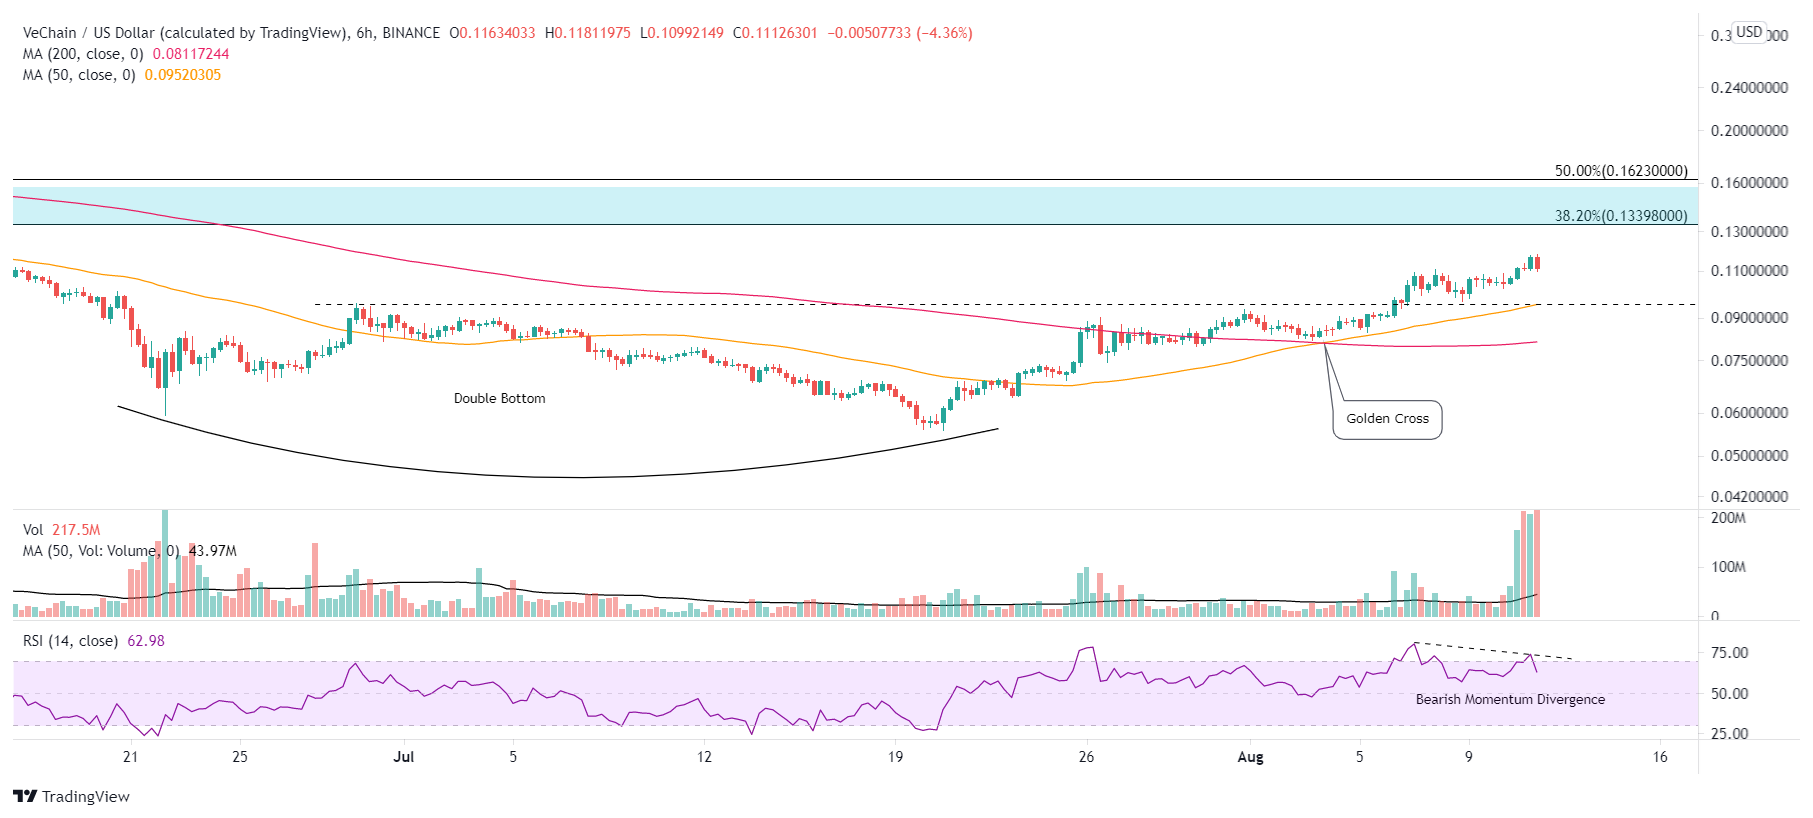
VET/USD 6-hour chart.
The VeChain price action and the volume profile following the breakout indicate accumulation by VET speculators. It supports higher prices and a test of the measured move target of $0.135 in the short term.
Author

Sheldon McIntyre, CMT
Independent Analyst
Sheldon has 24 years of investment experience holding various positions in companies based in the United States and Chile. His core competencies include BRIC and G-10 equity markets, swing and position trading and technical analysis.


