VeChain Price Prediction: VET strikes important resistance, may creep lower
- VeChain price tags 38.2% Fibonacci retracement level at $0.133 while recording an extreme overbought condition.
- VET is now successfully engaging the July ascending trend line around $0.114.
- The double bottom trigger price of $0.956 is crucial support if weakness accelerates.

VeChain price is now holding the July ascending trend line after finding stiff resistance at the 38.2% retracement level and the double bottom measured move target of $0.135. The VET pullback is set to continue, possibly testing the 200-day simple moving average (SMA) at $0.104 before engineering the next leg higher for the rally.
VeChain price jitters may be shortlived
VeChain price rallied over 160% from the July 20 low to the August 16 high of $0.146, lifting VET to the highest levels since the beginning of June and to the 38.2% retracement of the April-July correction at $0.133, but paced the daily Relative Strength Index (RSI) to the highest reading since April and one of the highest readings ever.
The severely overbought condition coupled with the firm resistance attributed to the 38.2% retracement at $0.133 and the double bottom’s measured move target of $0.135 have pushed VeChain price lower and to a test of the July ascending trend line around $0.114.
The VeChain price consolidation may be limited in duration, raising the importance of the 38.2% and 50% retracement levels at $0.133 and $0.162, respectively. The resistance implicit in the retracement levels is fortified by a series of highs and lows going back to April, suggesting that VET may need a catalyst to release above $0.162. A rise to the 50% retracement would represent a 28% gain from the current price.
With a daily close above $0.162, VeChain price does not confront noteworthy resistance until the May high of $0.260 and then the VET all-time high of $0.282, printed on April 17.
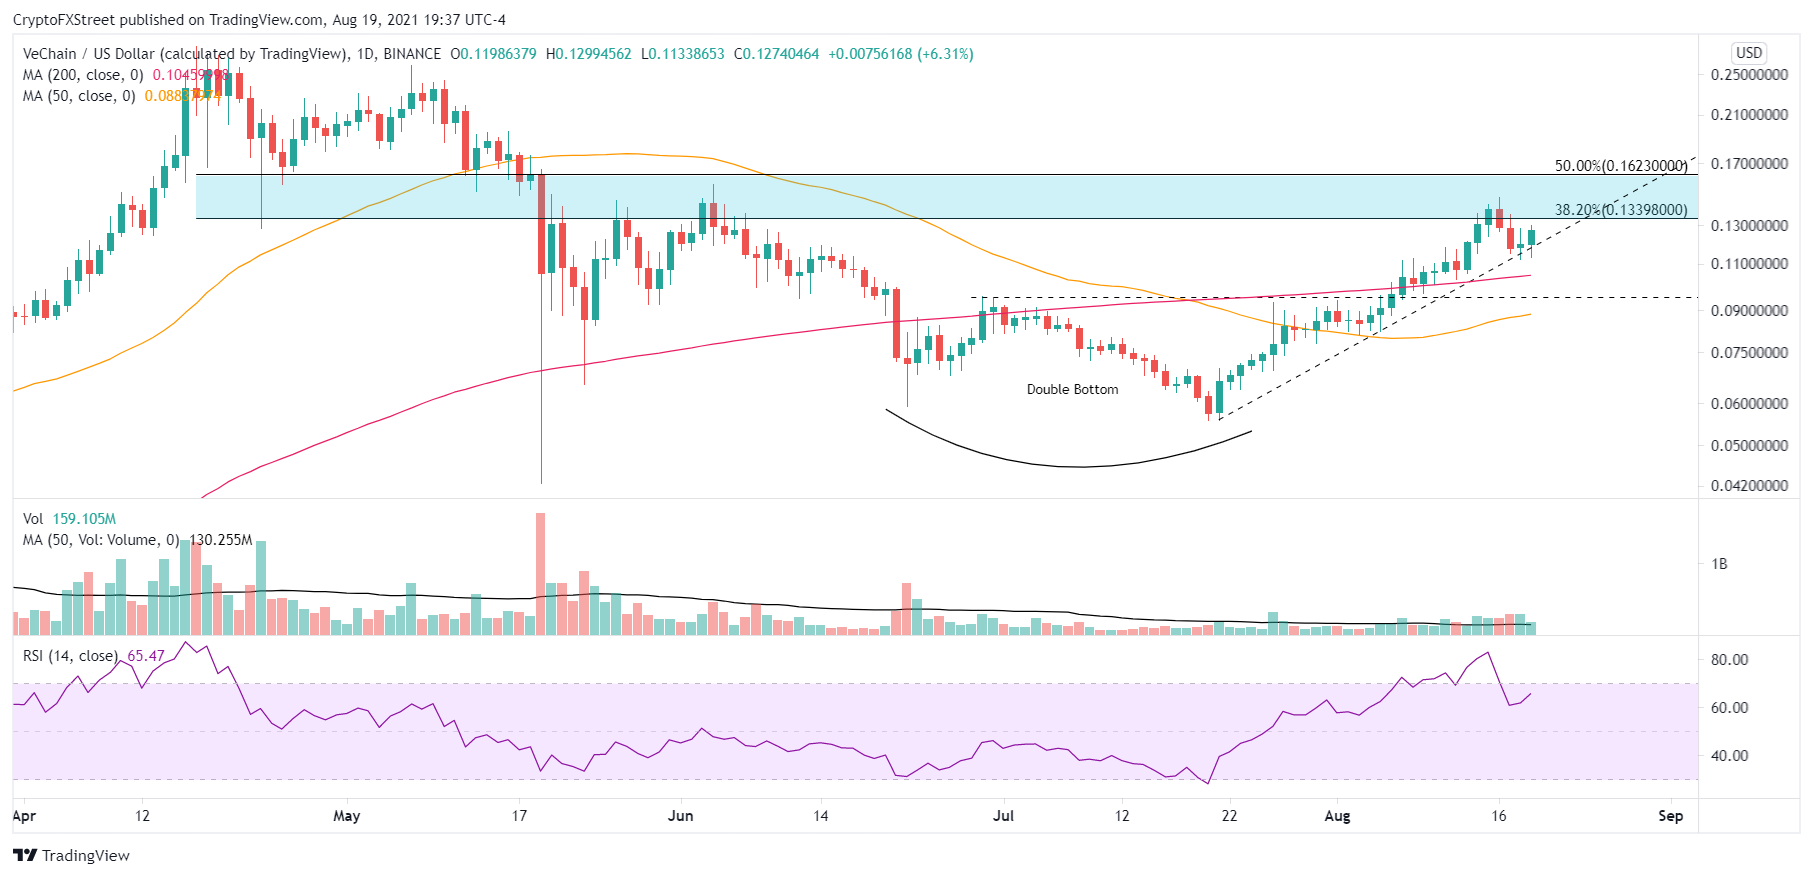
VET/USD daily chart
A failure to hold the trend line on a daily closing basis will press VeChain price to the 200-day SMA at $0.104 and then the double bottom trigger price from June 29 at $0.095. The 50-day SMA should contain any further weakness at $0.088. However, suppose VET does not strike support at $0.088 on a daily closing basis. In that case, the longer-term bullish forecast will be in focus as there is no conclusive support until the 50-week SMA at $0.069, presenting a 45% collapse from the current price.
Based on the momentum behind the VeChain price rally, there is reason to be optimistic about the potential for VET to limit the pullback to the July ascending trend line and quickly march higher through the mentioned resistance. However, market operators should not be surprised if the altcoin proceeds to test the 200-day SMA or even the double bottom entry price. It would not undermine the positive outlook, just clear any pockets of weak holders within the VET investor ranks.
Here, FXStreet's analysts evaluate where VET could be heading next as it looks for support.
Author

Sheldon McIntyre, CMT
Independent Analyst
Sheldon has 24 years of investment experience holding various positions in companies based in the United States and Chile. His core competencies include BRIC and G-10 equity markets, swing and position trading and technical analysis.



