VeChain price is very likely to drop by 21% to $0.10 after crucial rejection
- VeChain price has struggled to close above the 4-hour Kijun-Sen in the Ichimoku system.
- Bearish continuation pattern signals a warning of price dropping.
- The 61.8% Fibonacci expansion is the likely target zone on the continuation move lower.

VeChain price remains trading at a level significantly higher than the lows it made during the flash crash on Tuesday. It is currently trading up 25% since then, but the current swing structure and bearish continuation setup point to a likely re-test of the Tuesday lows.
VeChain price shows a Bear Flag pattern
There are two noticeable bear flag patterns on VeChain’s chart. The first is on the candlestick chart, which terminates against the Kijun-Sen at $0.128. The Kijun-Sen has been the primary resistance level on the 4-hour chart since the first significant bounce from the Tuesday low.
The second bearish formation is on VeChain’s Relative Strength Index. The last high of the bear flag channel on the Relative Strength Index topped out at 45. 45 is the first overbought condition in a bear market.
Adding to the likelihood of another move lower is the hidden bearish divergence between the candlestick chart and the Composite Index. Upon confirmation of the bear flag initiating another leg south, the target area is the 61.8% Fibonacci expansion at $0.100.
However, most Fibonacci expansions (especially those coming off of the first pullback/throwback) will reach their 100% level. If the 100% Fibonacci expansion scenario plays out, then VeChain would be trading at the $0.085 level.
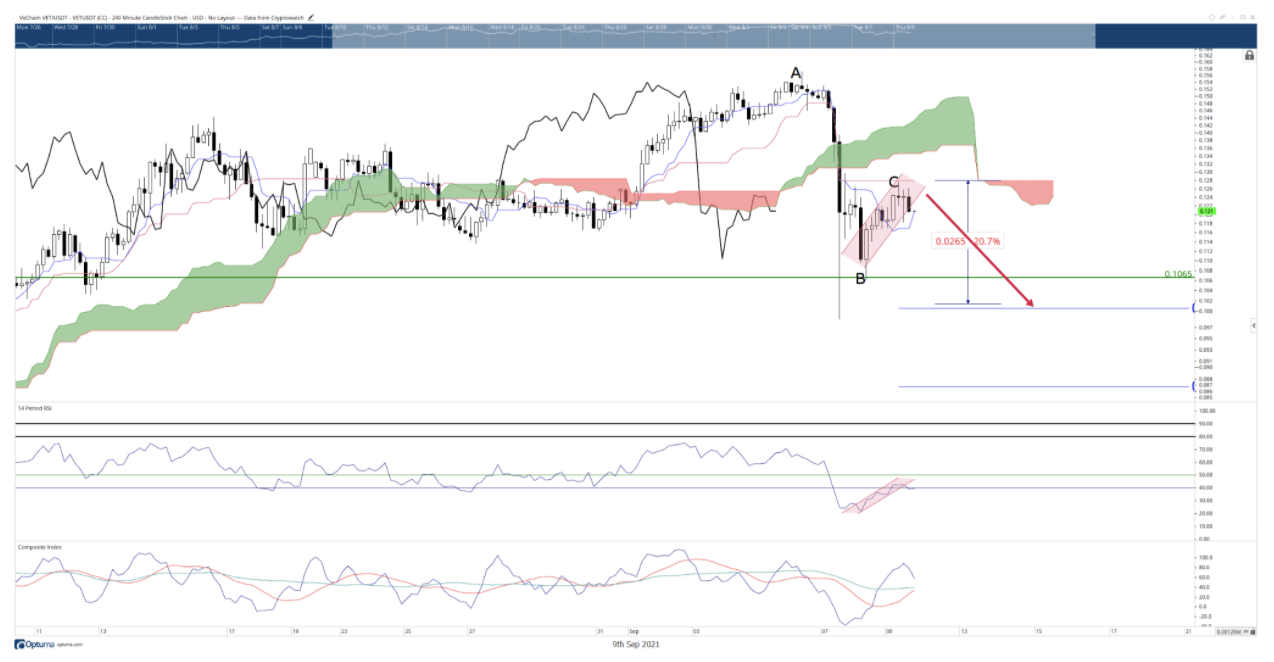
VET/USDT 4-hour chart
Bears may want to temper any excitement or expectation of a move below the $0.10 level. The bottom of the Cloud (Senkou Span B) on the daily chart and the 50% Fibonacci retracement fall into the $0.10 value area.
The bearish continuation scenario will be invalidated if VeChain price returns to a close above the $0.15 level.
Author
FXStreet Team
FXStreet
Composed of a group of economic journalists and FX experts, the FXStreet content team produces and oversees all content published on FXStreet. It provides a purely journalistic approach to the Forex market.


