- VeChain price breaks above a falling wedge pattern, projecting a bullish outlook.
- Bybit announces the listing of VET on its exchange.
- The technical outlook suggests rallying ahead, targeting double-digit gains.
VeChain (VET) price hovers around $0.023 on Tuesday after breaking above a falling wedge pattern the previous day; a breakout of this pattern favors the bulls. Bybit announced on Monday that VET would be listed on its exchange. Moreover, the technical outlook suggests rallying ahead, targeting double-digit gains.
Bybit lists VET on its exchange
Bybit, a centralized crypto exchange, announced Monday that it will list VeChain on its Spot trading platform. The listing process will begin with VET deposits opening on Monday at 6 AM UTC. Trading will commence at 10 AM UTC the same day, with withdrawals available from Tuesday at 10 AM UTC. The listing of VeChain on Bybit indicates a bullish outlook for the VET token as it boosts liquidity and accessibility for VeChain’s ecosystem.
$VET is now listed and open for trading on @Bybit_Official!
— VeChain (@vechainofficial) April 14, 2025
Check out their announcements page for details on how to get involved in the listing event:
> https://t.co/yhCZMsPGgD https://t.co/YGYCRDZ4us pic.twitter.com/I5K6dkjRXS
VeChain bulls target 17% gains
VeChain price broke above the falling wedge pattern (drawn by connecting multiple high and low levels with two trendlines from early February) on Monday and rose almost 3% that day. The breakout of this pattern favors the bulls. At the time of writing on Tuesday, it trades slightly above $0.023.
If VET continues its upward momentum, it could extend the rally by 17% from its current levels to retest its high of $0.027. A successful close above this could extend an additional rally by 21% to test its March 3 high of $0.033.
The Relative Strength Index (RSI) on the daily chart reads 51, pointing upward above its neutral level of 50, indicating bullish momentum. Moreover, the Moving Average Convergence Divergence (MACD) indicator also showed a bullish crossover last week, giving buy signals and suggesting a continuation of an upward trend.

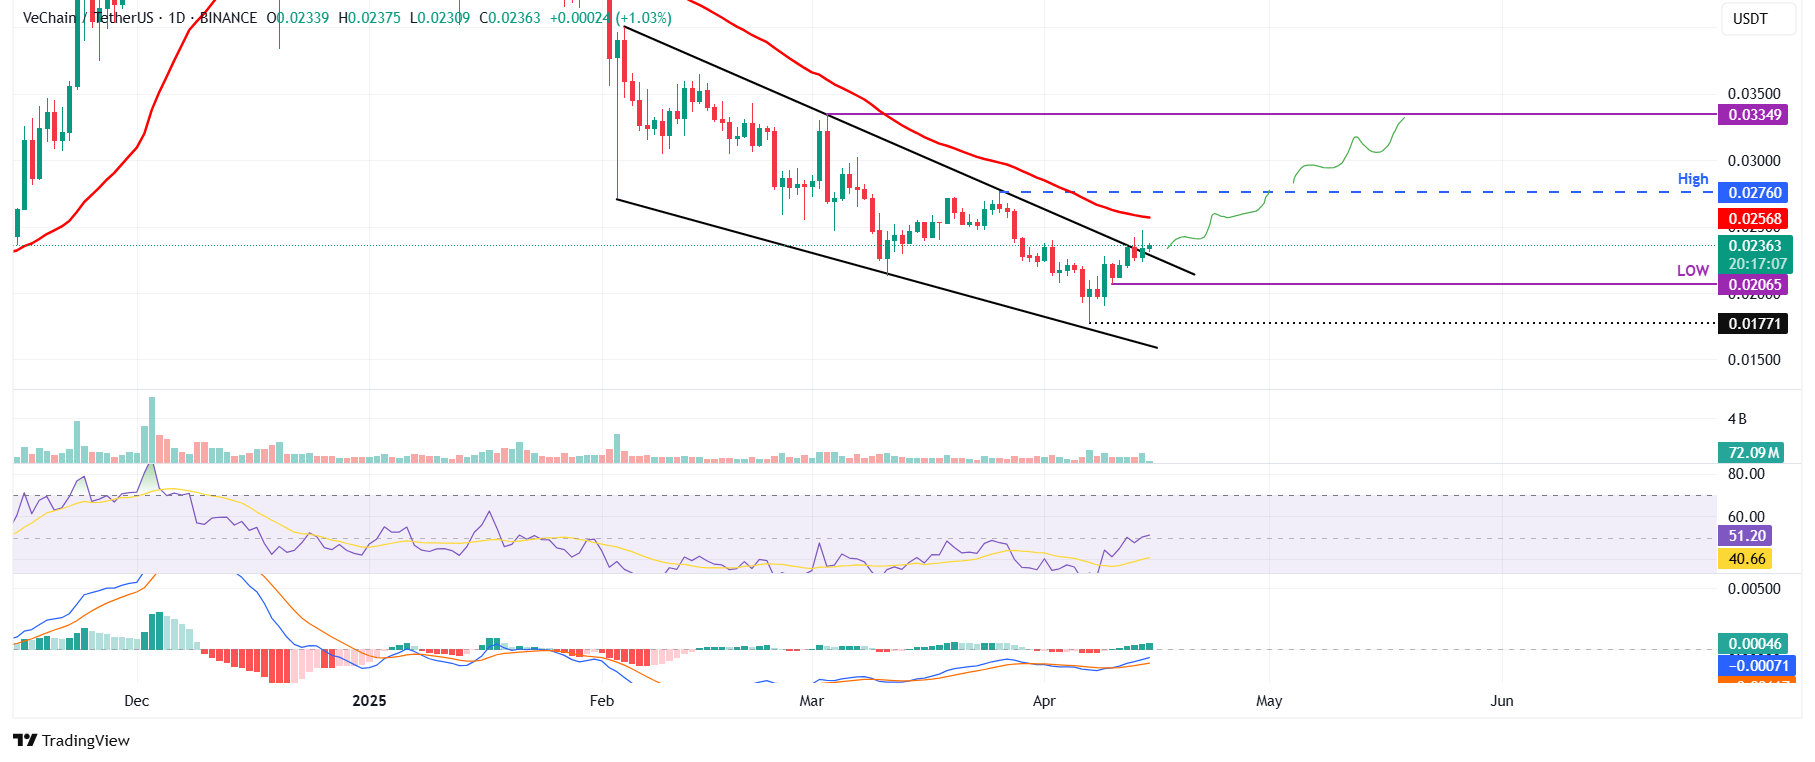
VET/USDT daily chart
However, if VET declines and closes below the April 10 low of $0.020, the bullish thesis will be invalidated. This development would lead to a price decline to retest its next support level at $0.017.
Information on these pages contains forward-looking statements that involve risks and uncertainties. Markets and instruments profiled on this page are for informational purposes only and should not in any way come across as a recommendation to buy or sell in these assets. You should do your own thorough research before making any investment decisions. FXStreet does not in any way guarantee that this information is free from mistakes, errors, or material misstatements. It also does not guarantee that this information is of a timely nature. Investing in Open Markets involves a great deal of risk, including the loss of all or a portion of your investment, as well as emotional distress. All risks, losses and costs associated with investing, including total loss of principal, are your responsibility. The views and opinions expressed in this article are those of the authors and do not necessarily reflect the official policy or position of FXStreet nor its advertisers. The author will not be held responsible for information that is found at the end of links posted on this page.
If not otherwise explicitly mentioned in the body of the article, at the time of writing, the author has no position in any stock mentioned in this article and no business relationship with any company mentioned. The author has not received compensation for writing this article, other than from FXStreet.
FXStreet and the author do not provide personalized recommendations. The author makes no representations as to the accuracy, completeness, or suitability of this information. FXStreet and the author will not be liable for any errors, omissions or any losses, injuries or damages arising from this information and its display or use. Errors and omissions excepted.
The author and FXStreet are not registered investment advisors and nothing in this article is intended to be investment advice.
Recommended Content
Editors’ Picks

Altcoin Season Beckoning: What's behind Sui, Stacks and Fartcoin price rallies?
The cryptocurrency market sparkles with altcoins like Sui, Stacks and Fartcoin extending gains on Monday. Sui breaks above a critical descending trendline, but the 100-day EMA crossing below the 200-day EMA signals potential bearish hurdles.

Bitcoin soars above $87,000 amid $500 million Bitcoin Reserve Bill debate on Wednesday
Bitcoin price breaks and trades above its key resistance level of $85,000 at the time of writing on Monday after facing multiple rejections the previous week. Institutional demand shows mild recovery, as it recorded nearly $16 million inflow into Bitcoin spot Exchange Traded Funds last week.

Why is PancakeSwap rallying today?
PancakeSwap breaks out, reclaiming $2.00 in support as investors return. The implementation of the tokenomics 3.0 software upgrade will allow access to staked CAKE and cake. PancakeSwap is shifting its focus from a 5% trading fees revenue sharing model to the CAKE token burn mechanism.

Altcoins to watch this week: ONDO and SUI bulls aim for double-digit gains
Ondo (ONDO) and SUI (SUI) prices gain nearly 5% at the time of writing on Monday, after a slight decline in the previous week. Both altcoins are approaching their key resistance levels; a breakout would indicate a bullish rally ahead.

Bitcoin Weekly Forecast: BTC holds steady, Fed warns of tariffs’ impact, as Gold hits new highs
Bitcoin price consolidates above $84,000 on Friday, a short-term support that has gained significance this week. The world's largest cryptocurrency by market capitalization continued to weather storms caused by US President Donald Trump's incessant trade war with China after pausing reciprocal tariffs for 90 days on April 9 for other countries.

The Best brokers to trade EUR/USD
SPONSORED Discover the top brokers for trading EUR/USD in 2025. Our list features brokers with competitive spreads, fast execution, and powerful platforms. Whether you're a beginner or an expert, find the right partner to navigate the dynamic Forex market.