Bitcoin Price Forecast: BTC retests key resistance at $85K, breakout to $90K or rejection to $78K?
- Bitcoin price approaches its key resistance at $85,000 on Monday, with a breakout indicating a bullish trend ahead.
- Metaplanet announced that it purchased an additional 319 BTC, bringing its total holdings to 4,525 BTC.
- Amberdata shows that the $100,000 strike price has the highest open interest, indicating a bullish sentiment among traders.
- US spot Bitcoin ETFs recorded a total net outflow of $713.30 million last week.

Bitcoin (BTC) price edges higher and approaches its key resistance at $85,000 on Monday, with a breakout indicating a bullish trend ahead. Metaplanet announced Monday that it purchased an additional 319 BTC, bringing its total holdings to 4,525 BTC. Additionally, Amberdata shows that the $100,000 strike price has the highest open interest (OI), indicating a bullish sentiment among traders. However, institutional demand continues to weaken, as Bitcoin spot Exchange Traded Funds (ETFs) recorded a total net outflow of $713.30 million last week.
Metaplanet adds 319 BTC to its holding
Metaplanet, a Japanese investment firm, announced on Monday that it had purchased an additional 319 BTC for $26.30 million at an average price of $82,549 per Bitcoin, following its 160 BTC purchase on April 2. The firm currently holds a total of 4,525 BTC.
The public companies’ interest in Bitcoin indicates a growing acceptance of BTC as a strategic asset, boosting its legitimacy and potentially driving long-term adoption. This trend is generally bullish for Bitcoin’s price due to increased demand, reduced circulating supply, and positive market sentiment. If this trend continues, Bitcoin could see more stable price growth over the long term, but short-term fluctuations are likely to persist as the market adjusts to this new wave of institutional involvement.
*Metaplanet Purchases Additional 319 $BTC* pic.twitter.com/haBS1NjtwI
— Metaplanet Inc. (@Metaplanet_JP) April 14, 2025
Amberdata’s Open Interest by strike data shows that BTC calls open interest at the $100,000 strike exceeds $1.19 billion in notional terms (USD), making it the most significant single-strike OI, as shown in the chart below. This substantial concentration and notable activity at far out-of-the-money (OTM) strikes indicate strong bullish long-term sentiment and speculative positioning for outsized upside moves.
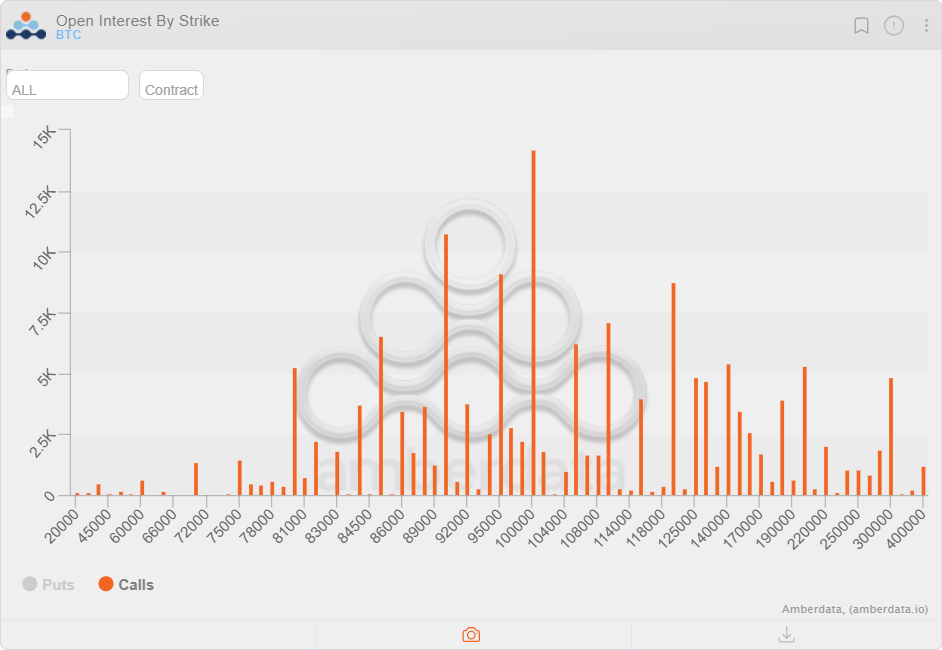
BTC calls open interest by strike notional chart. Source: Amberdata
Institutional demand for Bitcoin continues to fall
Institutional demand weakened as volatility and uncertainty arose in the market last week. According to the SoSoValue data, the US spot Bitcoin ETF recorded a net outflow of $713.30 million last week after a $172.69 million outflow in the previous one. The data further shows that the weekly netflow has been weak since mid-February, one month after Donald Trump’s inauguration on January 20. If the net outflow continues and intensifies, Bitcoin’s price could see further correction ahead.
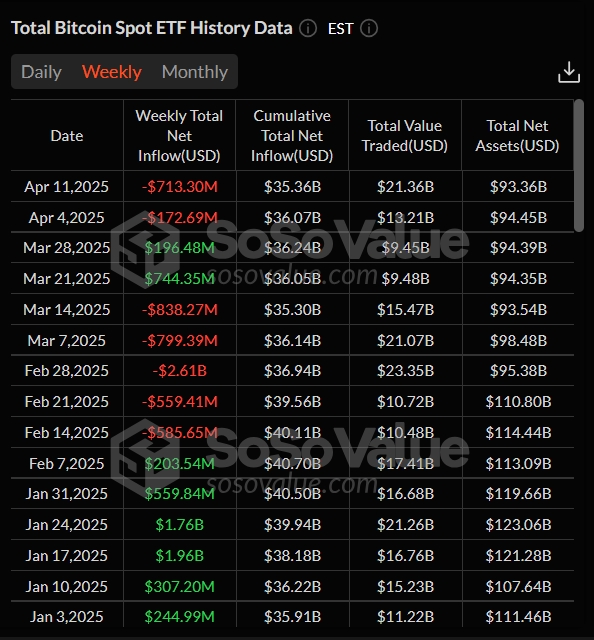
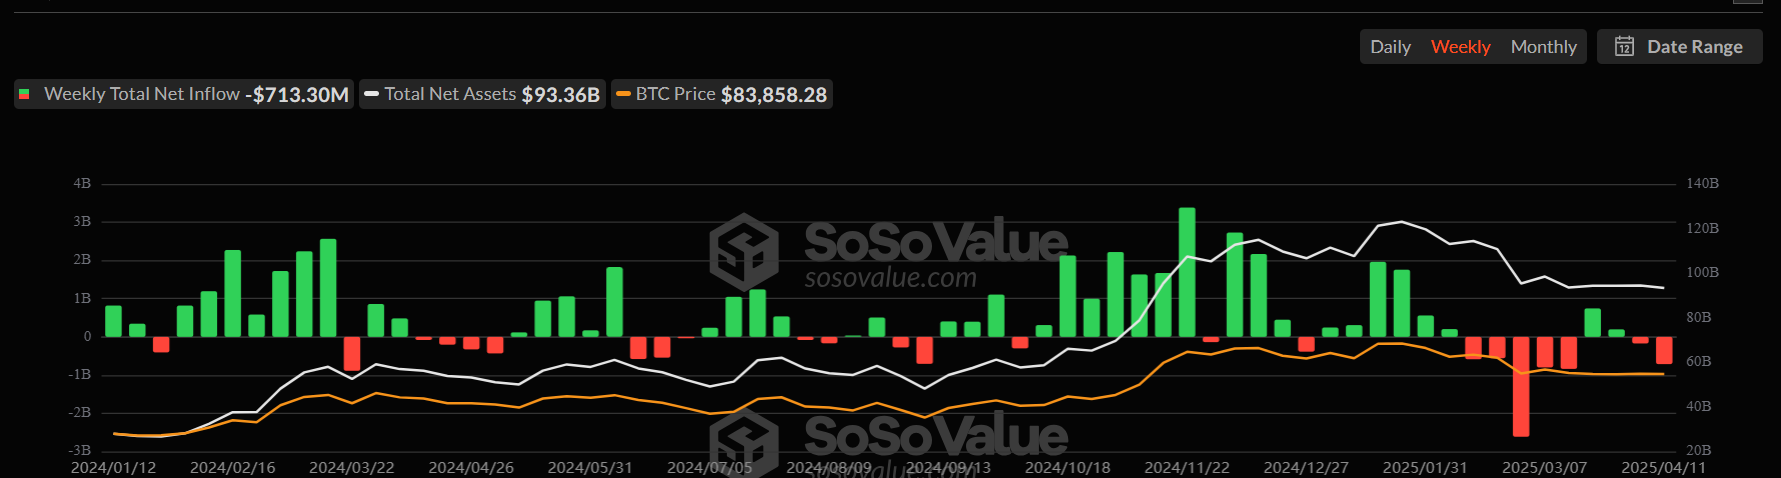
Total Bitcoin Spot netflow weekly chart. Source: SoSoValue
Bitcoin Price Forecast: Rally to $90,000 or drop to $78,000?
Bitcoin price broke and closed above its descending trendline (drawn by connecting multiple highs since mid-January) on Friday and rallied 2.22% the next day. However, on Sunday, BTC faced rejection at the $85,000 level, which coincides with the 200-day Exponential Moving Average (EMA) and the daily resistance level. At the time of writing on Monday, it trades at around $84,500.
If BTC breaks and closes above $85,000, it could extend the rally to the key psychological level of $90,000. A successful close above this level could extend an additional rally to test its March 2 high of $95,000.
The Relative Strength Index (RSI) on the daily chart flattens around its neutral level of 50, indicating indecisiveness among traders. The RSI must move above its neutral level for the bullish momentum to be sustained.
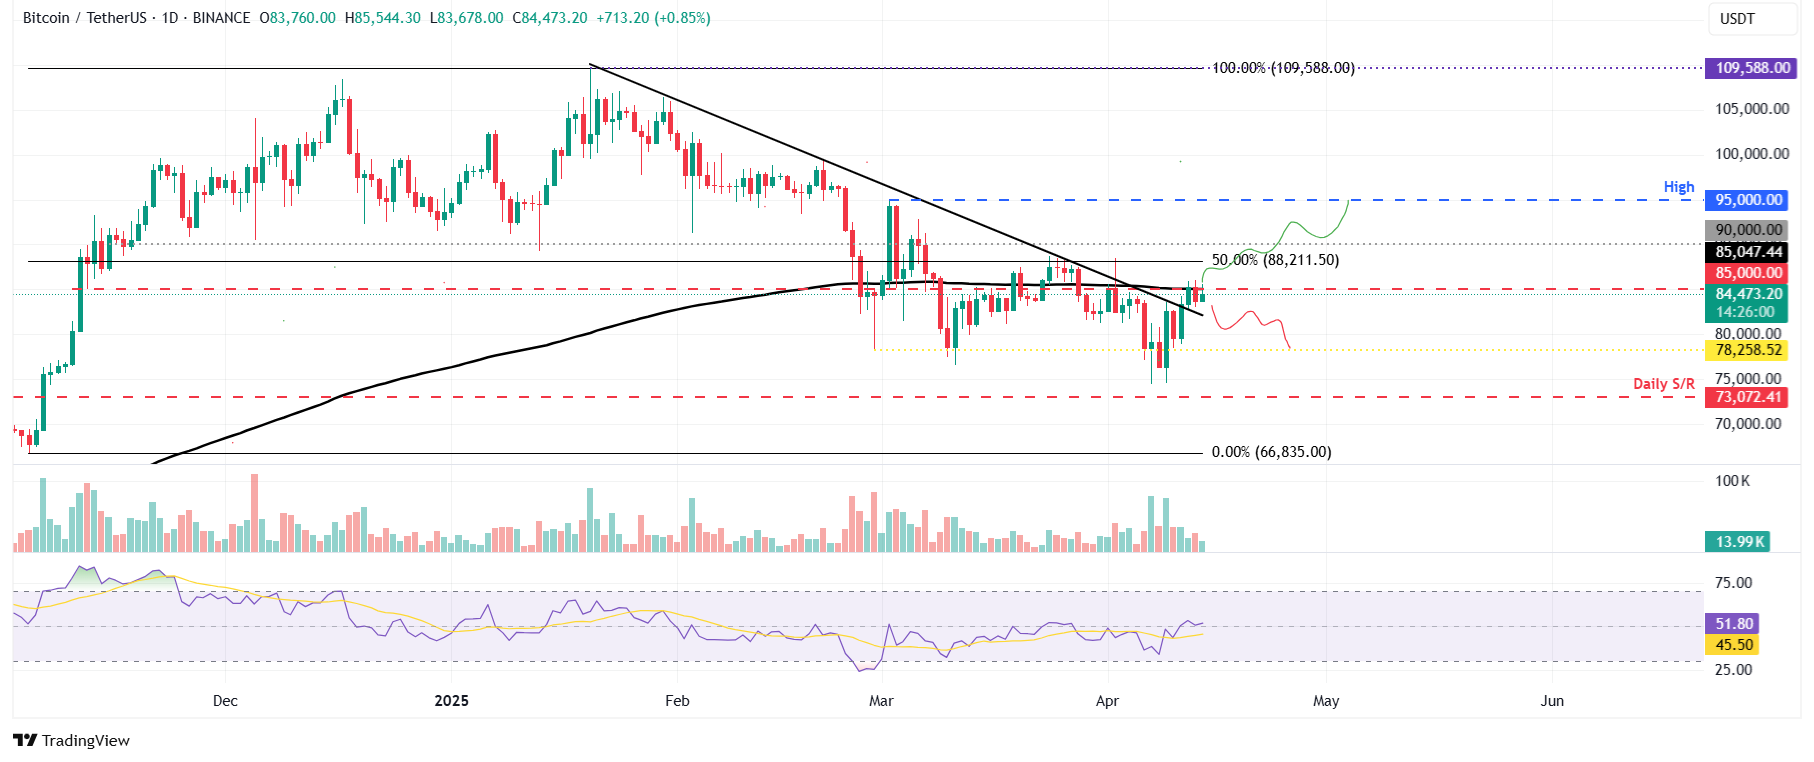
BTC/USDT daily chart
However, if BTC fails to close above $85,000 and continues its downward trend, it could extend the decline to retest its next daily support level at $78,258.
Bitcoin, altcoins, stablecoins FAQs
Bitcoin is the largest cryptocurrency by market capitalization, a virtual currency designed to serve as money. This form of payment cannot be controlled by any one person, group, or entity, which eliminates the need for third-party participation during financial transactions.
Altcoins are any cryptocurrency apart from Bitcoin, but some also regard Ethereum as a non-altcoin because it is from these two cryptocurrencies that forking happens. If this is true, then Litecoin is the first altcoin, forked from the Bitcoin protocol and, therefore, an “improved” version of it.
Stablecoins are cryptocurrencies designed to have a stable price, with their value backed by a reserve of the asset it represents. To achieve this, the value of any one stablecoin is pegged to a commodity or financial instrument, such as the US Dollar (USD), with its supply regulated by an algorithm or demand. The main goal of stablecoins is to provide an on/off-ramp for investors willing to trade and invest in cryptocurrencies. Stablecoins also allow investors to store value since cryptocurrencies, in general, are subject to volatility.
Bitcoin dominance is the ratio of Bitcoin's market capitalization to the total market capitalization of all cryptocurrencies combined. It provides a clear picture of Bitcoin’s interest among investors. A high BTC dominance typically happens before and during a bull run, in which investors resort to investing in relatively stable and high market capitalization cryptocurrency like Bitcoin. A drop in BTC dominance usually means that investors are moving their capital and/or profits to altcoins in a quest for higher returns, which usually triggers an explosion of altcoin rallies.
Author

Manish Chhetri
FXStreet
Manish Chhetri is a crypto specialist with over four years of experience in the cryptocurrency industry.


