Uniswap rises above key resistance, aiming for $7.50 ahead of first positive monthly return in 2025
- Uniswap surges above key descending trendline resistance, increasing the probability of an upswing targeting $7.50.
- UNI's rally in the last few weeks boosts the chances of the DEX native token achieving its first positive monthly return of the year.
- Uniswap remains bullish with the MACD indicator highlighting a buy signal, while the RSI approaches the overbought region.

Uniswap's (UNI) price grinds higher as sentiment steadies in the broader cryptocurrency market to trade at around $6.56 at the time of writing on Monday. The Decentralized Exchange (DEX) native token's intraday gains surpass 6%, increasing the chances of breaking a four-month negative monthly return streak. If Uniswap maintains its recent gains, it could achieve a positive monthly return by the end of May.
Uniswap breaks out targeting positive monthly return
Uniswap's bullish outlook, as depicted by the 4-hour chart, is supported by various micro and macro factors, including a nearly 14% increase in the derivatives market's Open Interest (OI) to approximately $400 million.
OI refers to the total number of active contracts comprising futures and options that have yet to be closed.
A subsequent surge in the volume by a staggering 54% to roughly $467 million over the past 24 hours implies growing trader interest and heightened participation as investors bet on the potential increase in the price of UNI.
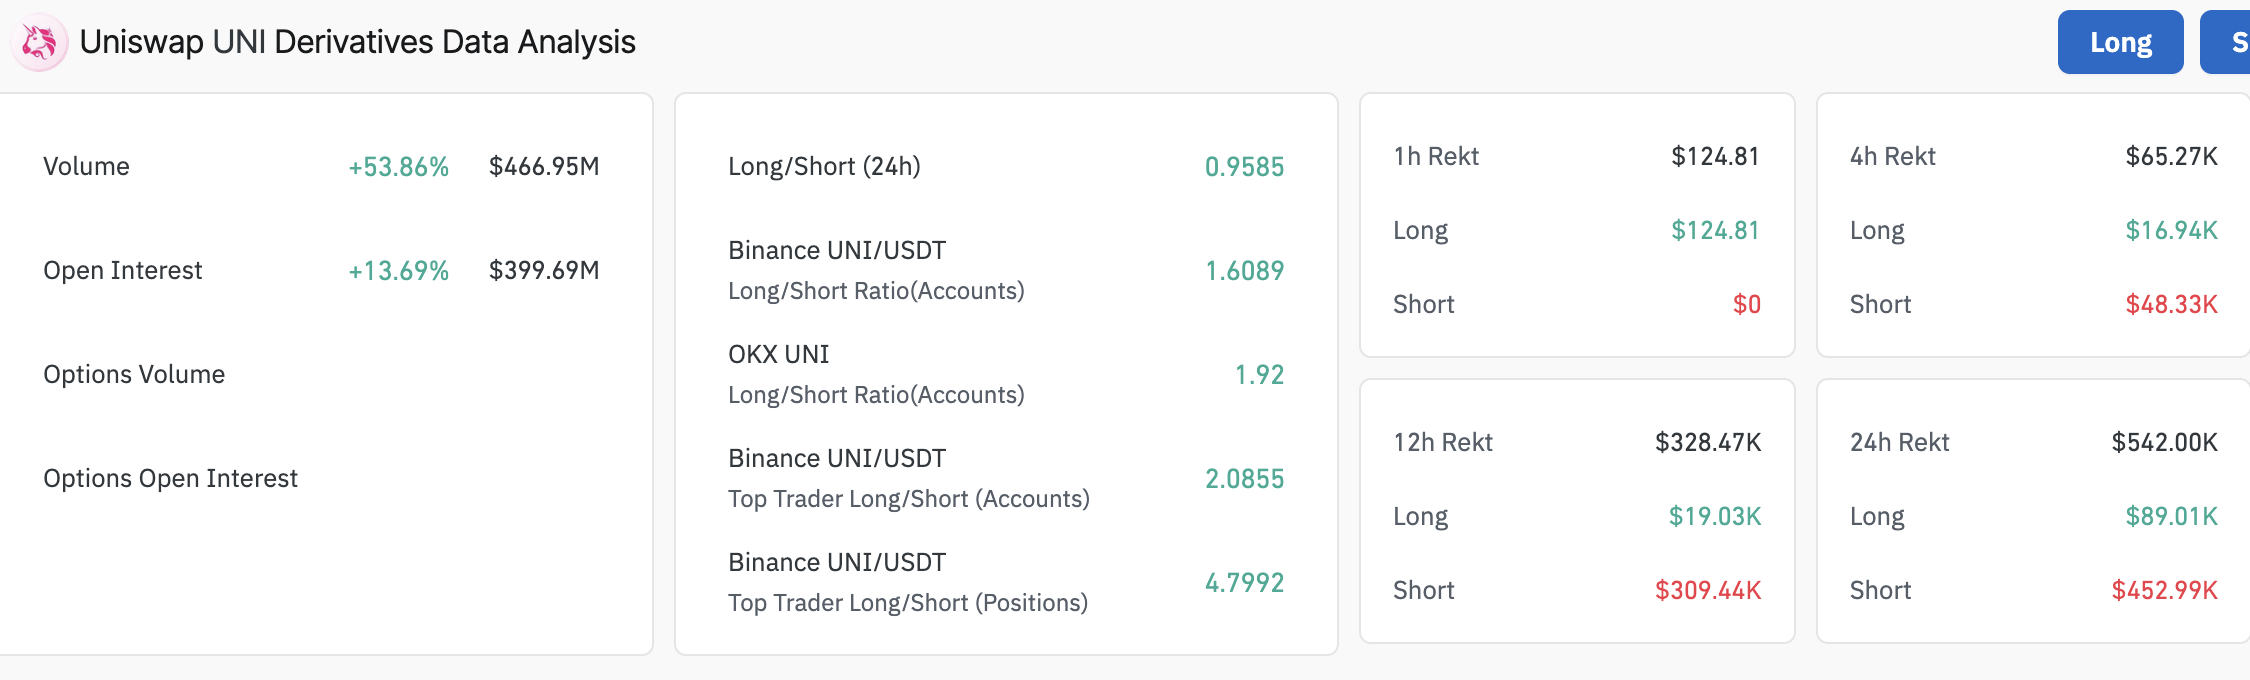
Uniswap derivatives market data | Source: CoinGlass
The spike in short position liquidations to around $453,000 compared to $89,000 over the last 24 hours points to a short squeeze. In other words, as Uniswap's price surges, traders buy UNI to cover their positions. This situation drives the price higher as buying pressure swells.
Uniswap's remarkable performance in the last few weeks, from May's lowest point at $4.37 to the prevailing market rate of $6.56, has set the token on an upward path likely to post the first positive monthly returns year-to-date (YTD).
CryptoRank's analytics data shows UNI's gains in May at 24.4%, with a few days to June. If bulls hold onto the gains, UNI will break the bearish streak since the beginning of the year. Uniswap's returns in January were -11.1%, with February recording a steeper drop to -36.2%, while March and April posted -20.4% and -11.6%, respectively.
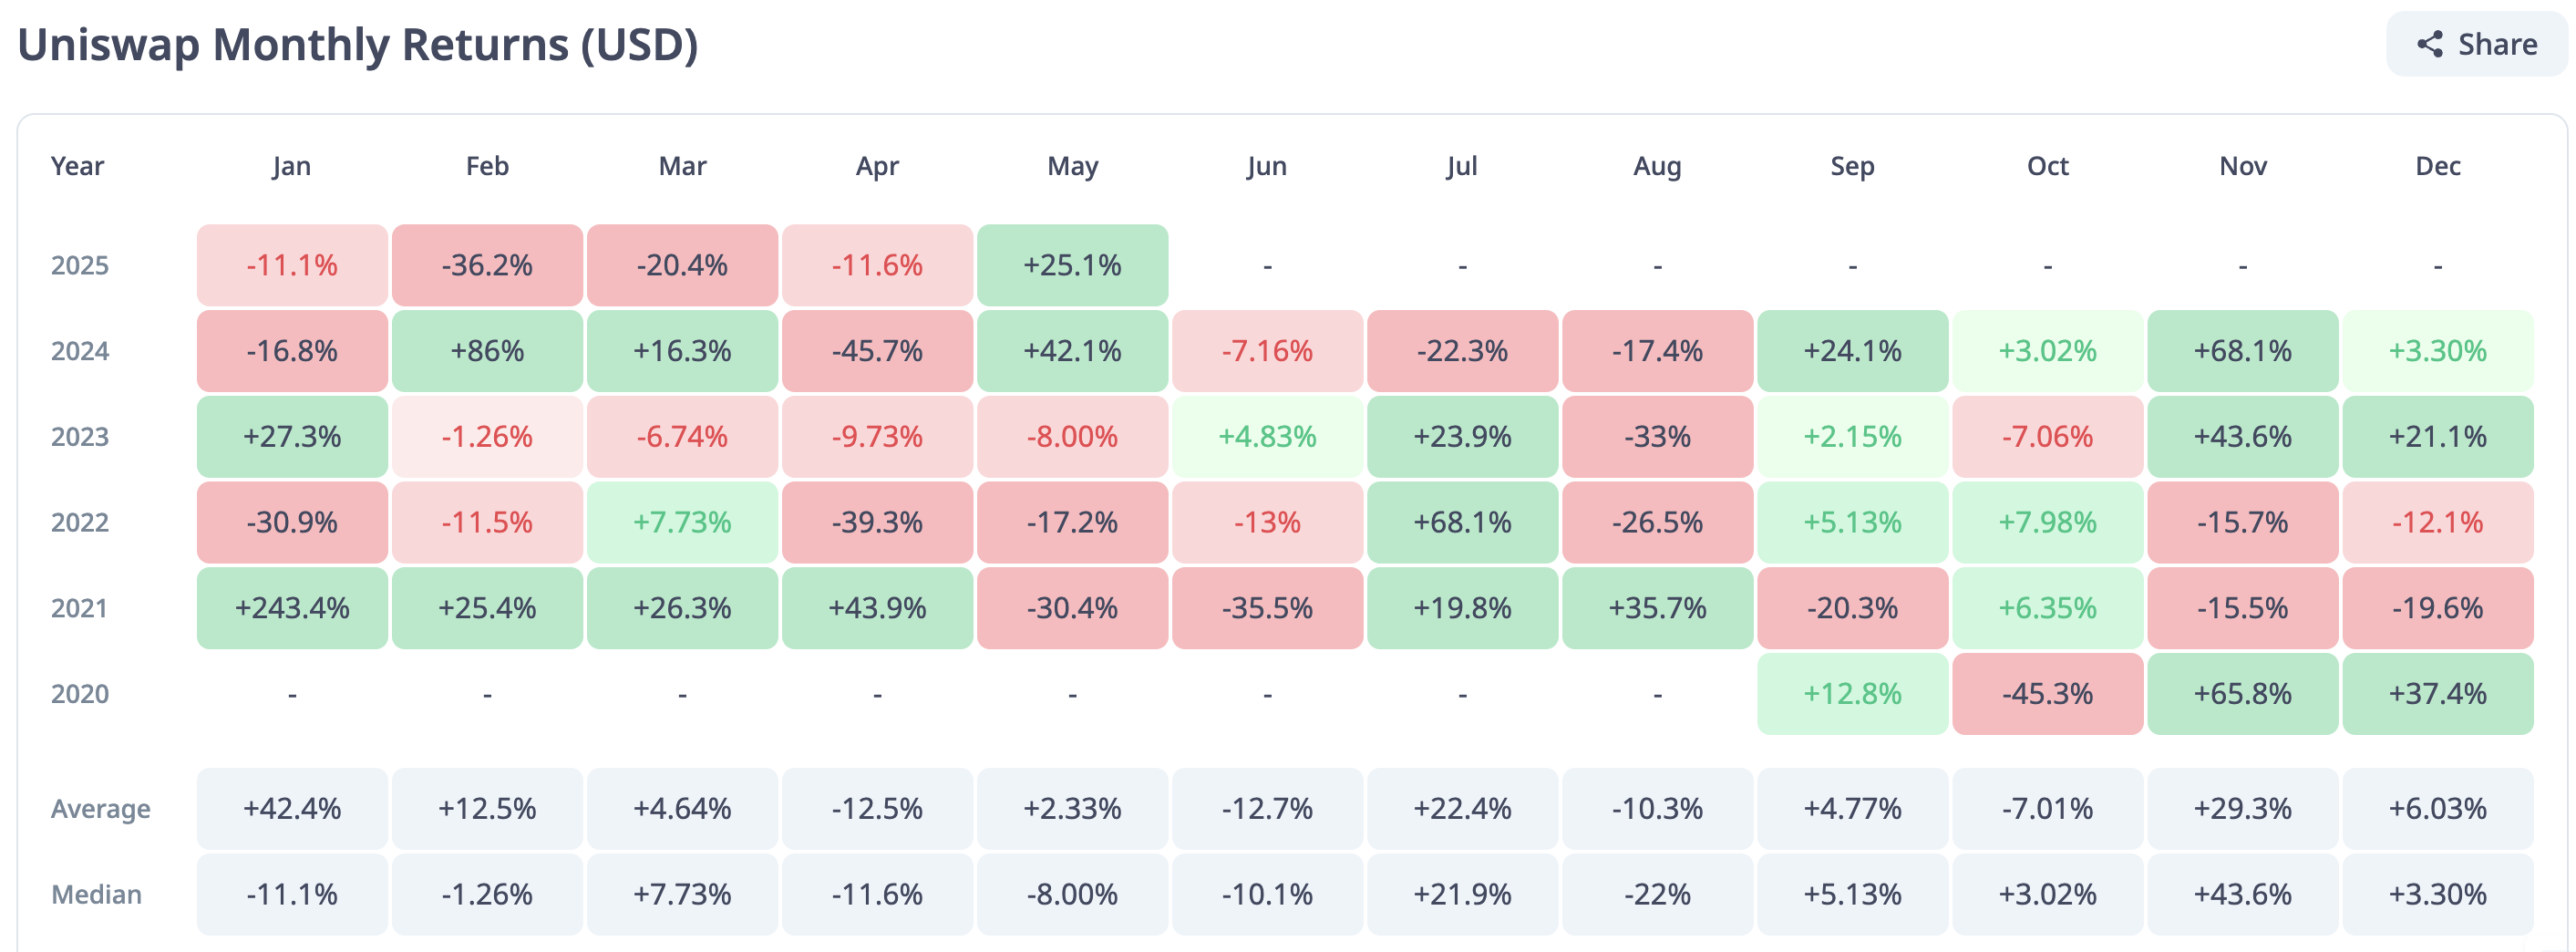
Uniswap monthly returns (USD) | Source: CryptoRank
Uniswap technical outlook: UNI flaunts multiple buy signals
Several buy signals firmly ground Uniswap's uptrend, targeting the $7.50 resistance area. The Moving Average Convergence Divergence (MACD) validated the signal during the Asian session when the MACD line (blue) crossed above the signal line (red).
Green histogram bars have continued to expand above the center line, urging traders to seek exposure to UNI as the price rises.
Another buy signal resulted from the SuperTrend indicator flipping below UNI on the 4-hour chart on May 18. This indicator measures volatility by incorporating the Average True Range (ATR), which can be used as a dynamic support and resistance. The path with the least resistance could stay strongly upward as long as the SuperTrend trails Uniswap's price, boosting its bullish potential.
The 4-hour chart below shows that UNI has broken above a key descending trendline. The DEX native token sits significantly above key moving averages, including the 4-hour 50-period Exponential Moving Average (EMA) at $6.19, the 100 EMA at $6.13 and the 200 EMA at 6.02.
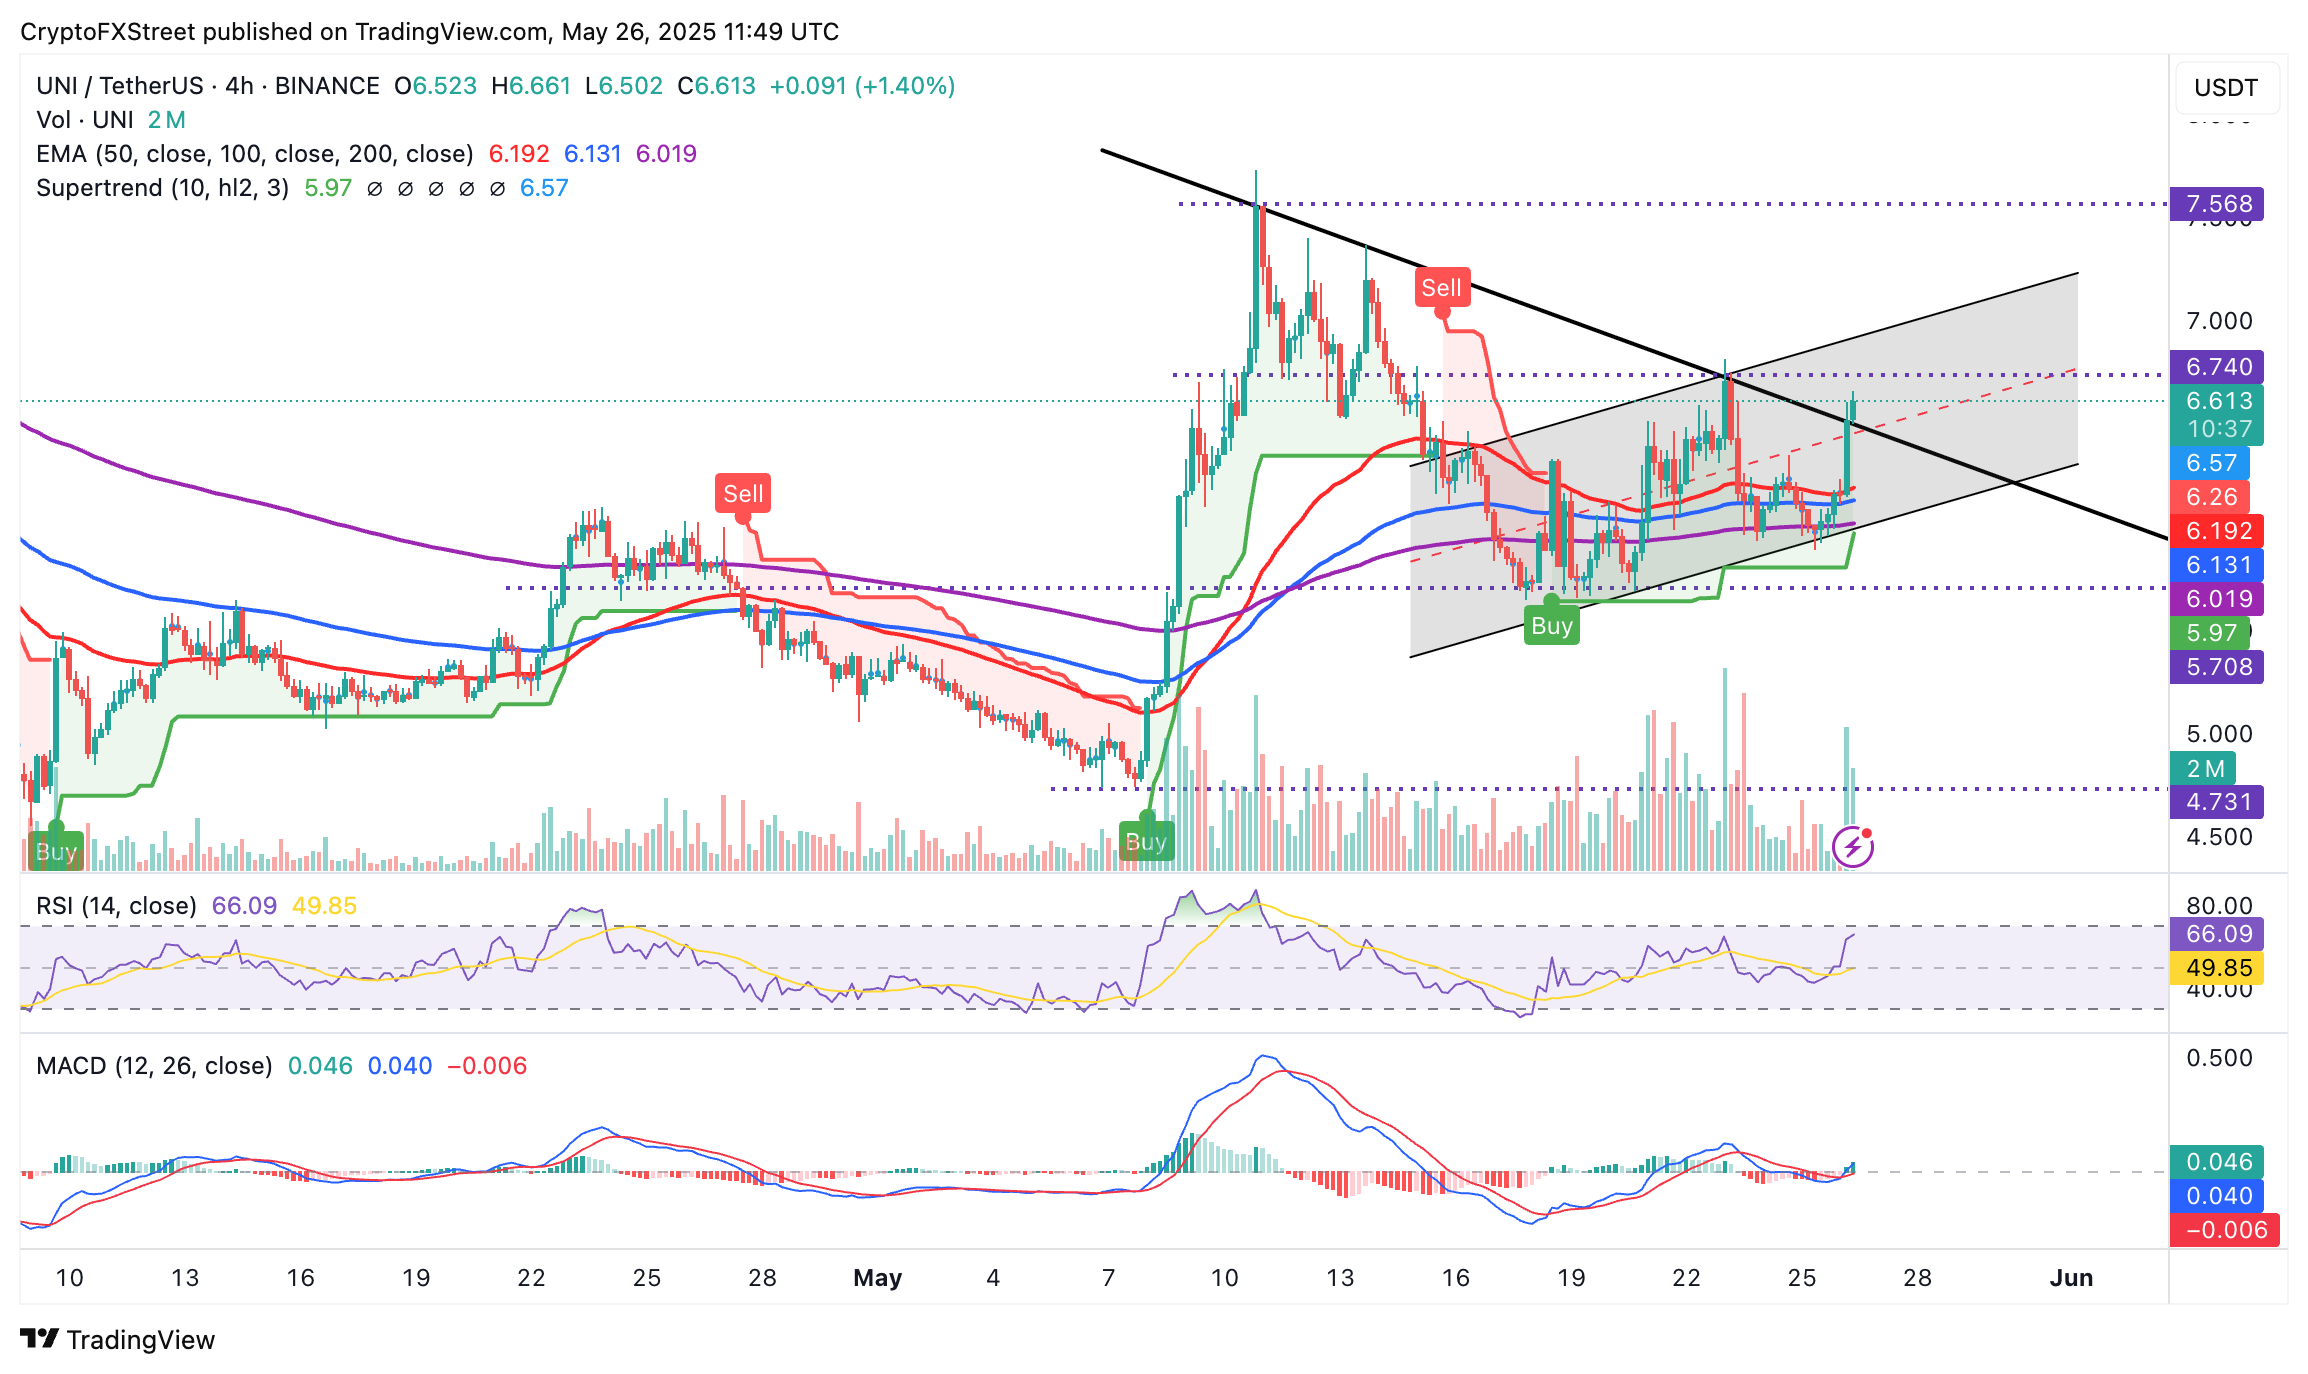
UNI/USD 4-hour chart
A 4-hour to a daily close above the trendline resistance-turned-support would encourage traders to seek exposure to UNI, anticipating a plausible rally toward the seller congestion at $7.50, tested last on May 5.
The Relative Strength Index (RSI) uptrend at 65 suggests that the uptrend is still strong and that UNI could grind higher in upcoming sessions. However, its proximity to the overbought region implies caution, as traders could take profits, significantly shifting market dynamics and leading to a trend reversal.
Open Interest, funding rate FAQs
Higher Open Interest is associated with higher liquidity and new capital inflow to the market. This is considered the equivalent of increase in efficiency and the ongoing trend continues. When Open Interest decreases, it is considered a sign of liquidation in the market, investors are leaving and the overall demand for an asset is on a decline, fueling a bearish sentiment among investors.
Funding fees bridge the difference between spot prices and prices of futures contracts of an asset by increasing liquidation risks faced by traders. A consistently high and positive funding rate implies there is a bullish sentiment among market participants and there is an expectation of a price hike. A consistently negative funding rate for an asset implies a bearish sentiment, indicating that traders expect the cryptocurrency’s price to fall and a bearish trend reversal is likely to occur.
Author

John Isige
FXStreet
John Isige is a seasoned cryptocurrency journalist and markets analyst committed to delivering high-quality, actionable insights tailored to traders, investors, and crypto enthusiasts. He enjoys deep dives into emerging Web3 tren




