Uniswap Price Forecast: UNI on the verge of new all-time highs
- Uniswap price is contained inside a symmetrical triangle pattern on the 4-hour chart.
- The number of tokens inside exchanges has continued to significantly drop in the past several months.
- A key indicator shows Uniswap faces practically no resistance on the way up.

Uniswap has been trading inside a tightening range since the beginning of March while the supply on exchanges has continued to decrease despite the significant price rise of the decentralized exchange.
Uniswap price aims for a huge 30% breakout with no resistance ahead
On the 4-hour chart, Uniswap price has established a symmetrical triangle pattern with the key resistance trendline formed at $32.3. A breakout above this key point would drive Uniswap price up by 30% towards $42.

UNI/USD 4-hour chart
Since December 11, 2020, Uniswap price has climbed from a low of $3 to an all-time high of $33. However, in the same time period, the percentage of Uniswap tokens on exchanges decreased from a high of 7% to 6.14% currently.
%20[17.53.25,%2017%20Mar,%202021]-637516006646809690.png)
UNI Tokens on Exchanges
This indicates that investors are not looking to sell UNI despite its performance, awaiting even more gains. The In/Out of the Money Around Price (IOMAP) chart suggests that bulls face practically no strong resistance above $30 with a lot of support on the way down.
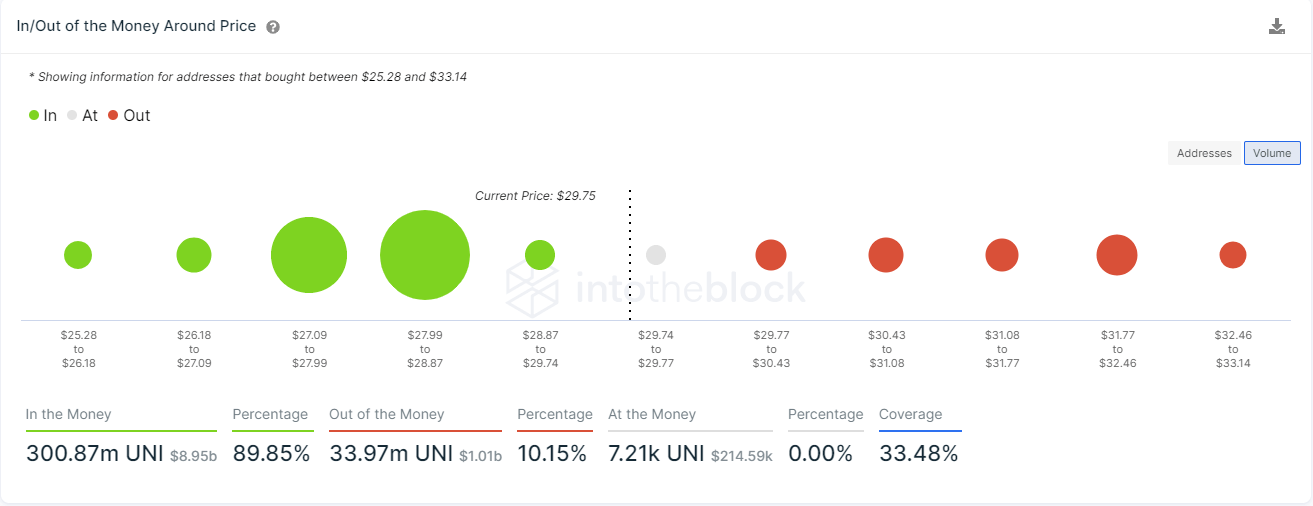
UNI IOMAP chart
The strongest support area is located between $28 and $29. A breakdown below this point would confirm a break from the symmetrical triangle pattern with a price target of 30% towards $20.
Author

Lorenzo Stroe
Independent Analyst
Lorenzo is an experienced Technical Analyst and Content Writer who has been working in the cryptocurrency industry since 2012. He also has a passion for trading.


