Uniswap Price Forecast: UNI flashes bullish reversal signal as buyers step in
- Uniswap price hovers around $6.18 on Friday after rallying over 26% the previous day.
- On-chain metrics suggest a bullish picture as UNI’s TVL, open interest, and token volume are rising.
- The technical outlook indicates a bullish breakout, signaling a potential trend reversal and upside momentum.

Uniswap (UNI) price stabilized at around $6.18 on Friday after rallying over 26% the previous day. On-chain metrics, such as UNI’s Total Value Locked (TVL), Open Interest (OI), and token volume, further support the bullish thesis. The technical outlook indicates a bullish breakout, signaling a potential trend reversal and upside momentum.
Uniswap’s on-chain data hints at a rally ahead
Data from crypto intelligence tracker DefiLlama shows that UNI’s TVL increased from $4.05 billion on Tuesday to $4.58 billion on Friday, the highest level since February 24. This increase in TVL indicates growing activity and interest within the Uniswap ecosystem, suggesting that more users are depositing or utilizing assets within UNI-based protocols.
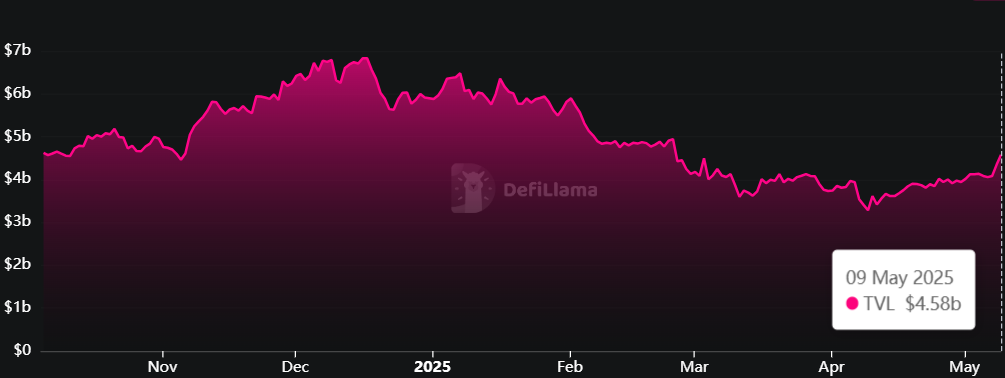
UNI TVL chart. Source: DefiLlama
Another factor bolstering the platform’s bullish outlook is a recent surge in traders’ interest and liquidity on the UNI chain. The daily token volume reached nearly $500 million on Friday, the highest level since February.
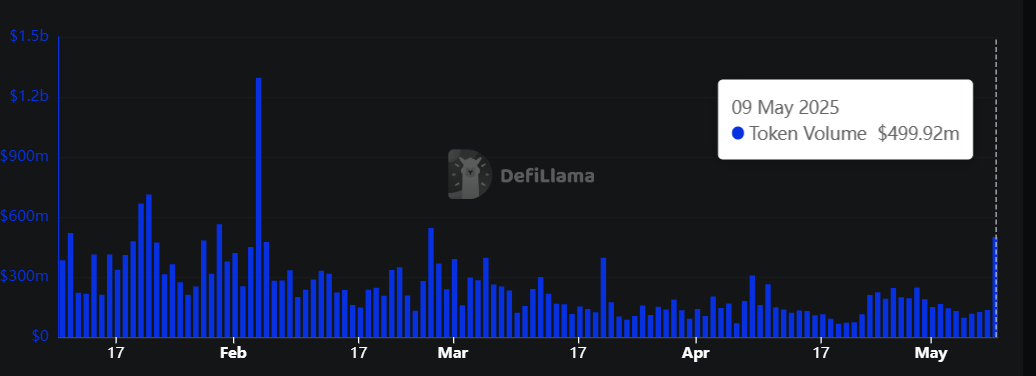
UNI Token Volume chart. Source: DefiLama
UNI’s Open Interest further supports the bullish outlook. Coinglass’s data shows that the futures’ OI in UNI at exchanges rose from $240.87 million on Monday to $359 million on Friday, the highest level since February 2. An increasing OI represents new or additional money entering the market and new buying, which should contribute to a price increase.
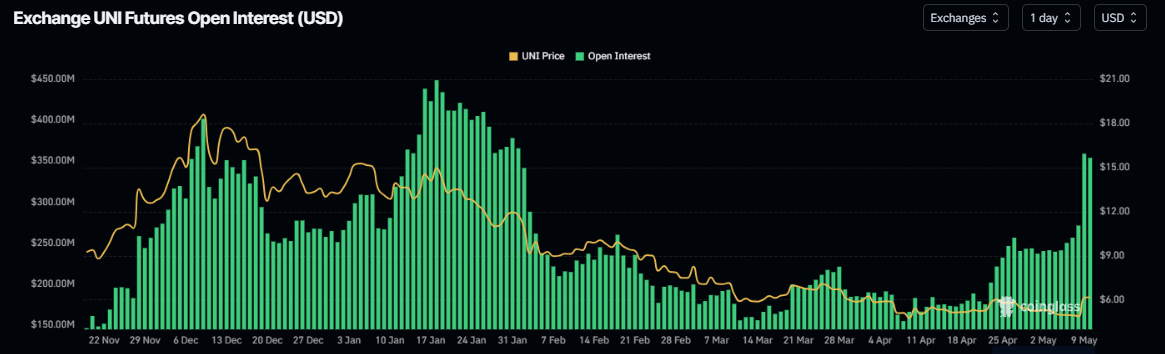
Uni open interest chart. Source: Coinglass
Uniswap Price Prediction: UNI breaks above the double-bottom bullish pattern
Uniswap price action found support and bounced after retesting the $4.77 level in early April. It faced rejection around the $6.04 level at the end of April and again found support around the $4.77 level this week. This price action shows the formation of a W-like structure known as a double-bottom pattern that often signals a potential trend reversal favoring the bulls. Moreover, on Thursday, it broke and closed above the neckline at $6.04, confirming the breakout of this bullish pattern. At the time of writing on Friday, it hovers above this neckline level, around $6.20.
The technical target of the double-bottom pattern is often calculated by measuring the pattern's height and projecting it above the neckline, which gives the target at $7.38, nearly 20% from the current trading level at $6.20.
The Relative Strength Index (RSI) on the daily chart reads 64, above its neutral level of 50, indicating bullish momentum. Moreover, the Moving Average Convergence Divergence (MACD) indicator also showed a bullish crossover on Thursday, giving buying signals and suggesting an upward trend.
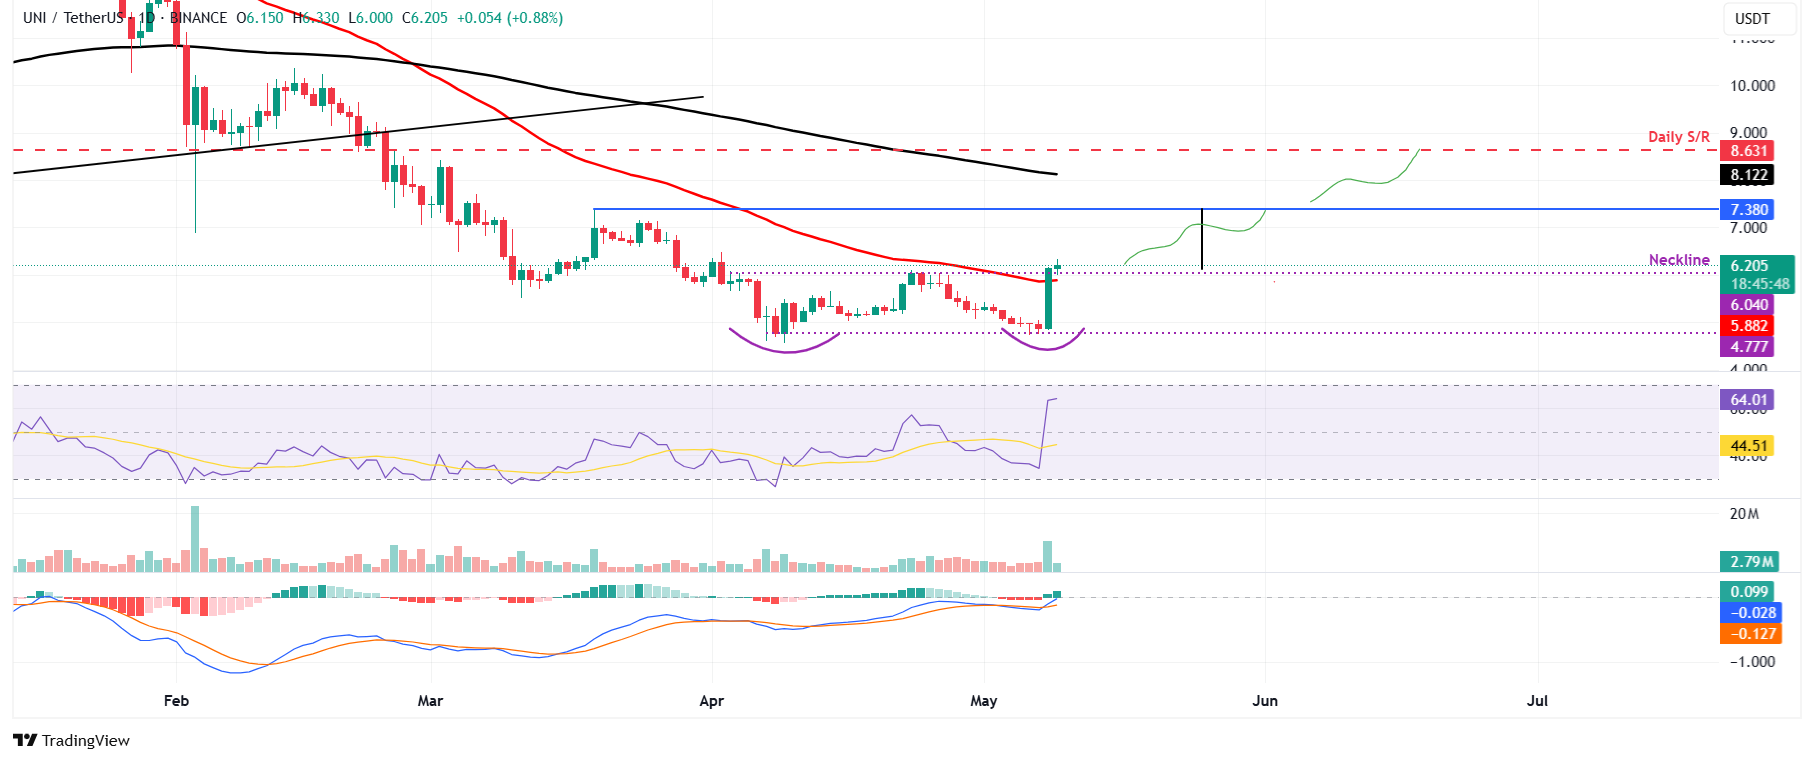
UNI/USDT daily chart
However, if UNi breaks and closes below its neckline support at $6.04, it could extend the decline to retest its next support level at $4.77.
Author

Manish Chhetri
FXStreet
Manish Chhetri is a crypto specialist with over four years of experience in the cryptocurrency industry.


