Top meme coins Dogecoin, Shiba Inu rally subdued as social buzz dwindles
- Dogecoin hovers below a critical descending trendline resistance since December.
- A sharp decline in chatter around DOGE, to 170 from the yearly peak of approximately 1,480, highlights a sentiment gap.
- Shiba Inu’s social mentions fall significantly below Dogecoin’s as bulls struggle with the short-term descending channel’s resistance.
- SHIB’s uptrend could steady above the 12-hour 200-period EMA in upcoming sessions if the 50-period EMA support holds.
The cryptocurrency market kicked off the week on a positive note as top meme coins, including Dogecoin (DOGE) and Shiba Inu (SHIB), pushed to regain strength after a slow and bearishly biased weekend. Last week’s surge, especially in Bitcoin (BTC), which reached new all-time highs of around $111,980, was mainly driven by strong institutional interest and, according to the latest Kaiko report, “late-night Asian buying.”
However, further gains have generally been subdued, with Bitcoin staying below $110,000 through most of the trading on Monday. Dogecoin and Shiba Inu highlight broader sideways trading as market dynamics adjust amid potential profit-taking.
Market overview: Dogecoin and Shiba Inu social chatter drops
The chatter around Dogecoin and Shiba Inu meme coins has faded significantly since the peaks in December and January. Santiment’s Social Volume indicator, which tracks the amount of mentions a coin receives on over 1,000 social media channels, including X, Telegram, subreddits and Discord groups, shows a sharp drop in the volume to roughly 170 from approximately 1,480 posted in January.
 [18-1748279750344.31.45, 26 May, 2025].png)
Dogecoin Social Volume | Source: Santiment
The same downtrend in social volume can be observed with the second-largest meme coin by market capitalization, Shiba Inu. Based on the chart below, the buzz around SHIB is down about 89% to 25 from 233 in January. Compared to levels seen in December, volume has plummeted by roughly 92% from December’s peak of 330.
 [18-1748279772095.37.52, 26 May, 2025].png)
Shiba Inu Social Volume | Source: Santiment
Declining social volume often signals reduced investor interest or hype, especially for meme coins. Price increase in DOGE, SHIB and other meme coins is fueled by community enthusiasm and social media buzz. These tokens can experience low trading activity and a sharp drop in demand, thus subduing price movement.
“Despite the price surge, market leverage remains relatively low signalling a lack of retail euphoria,” Kaiko states in the weekly data debrief. “Funding rates turned positive in early May, showing renewed bullish sentiment, but they remain far below the overheated levels seen during the post-election rally,” the report explains.
Technical outlook: Analysing the next direction for Dogecoin and Shiba Inu
Dogecoin’s price holds above key moving averages, ranging from the 200-day Exponential Moving Average (EMA), the 100-day EMA to the 50-day EMA, hinting at a stable market structure.
Supporting DOGE’s bullish outlook is a buy signal from the SuperTrend indicator. This trend-following tool utilizes Average True Range (ATR) data to gauge market volatility.
A buy signal occurs when the price flips above the SuperTrend, changing the color to green from red. Traders can use this tool as a dynamic support and resistance, which currently anchors Dogecoin’s bullish outlook, as illustrated by the daily chart below.
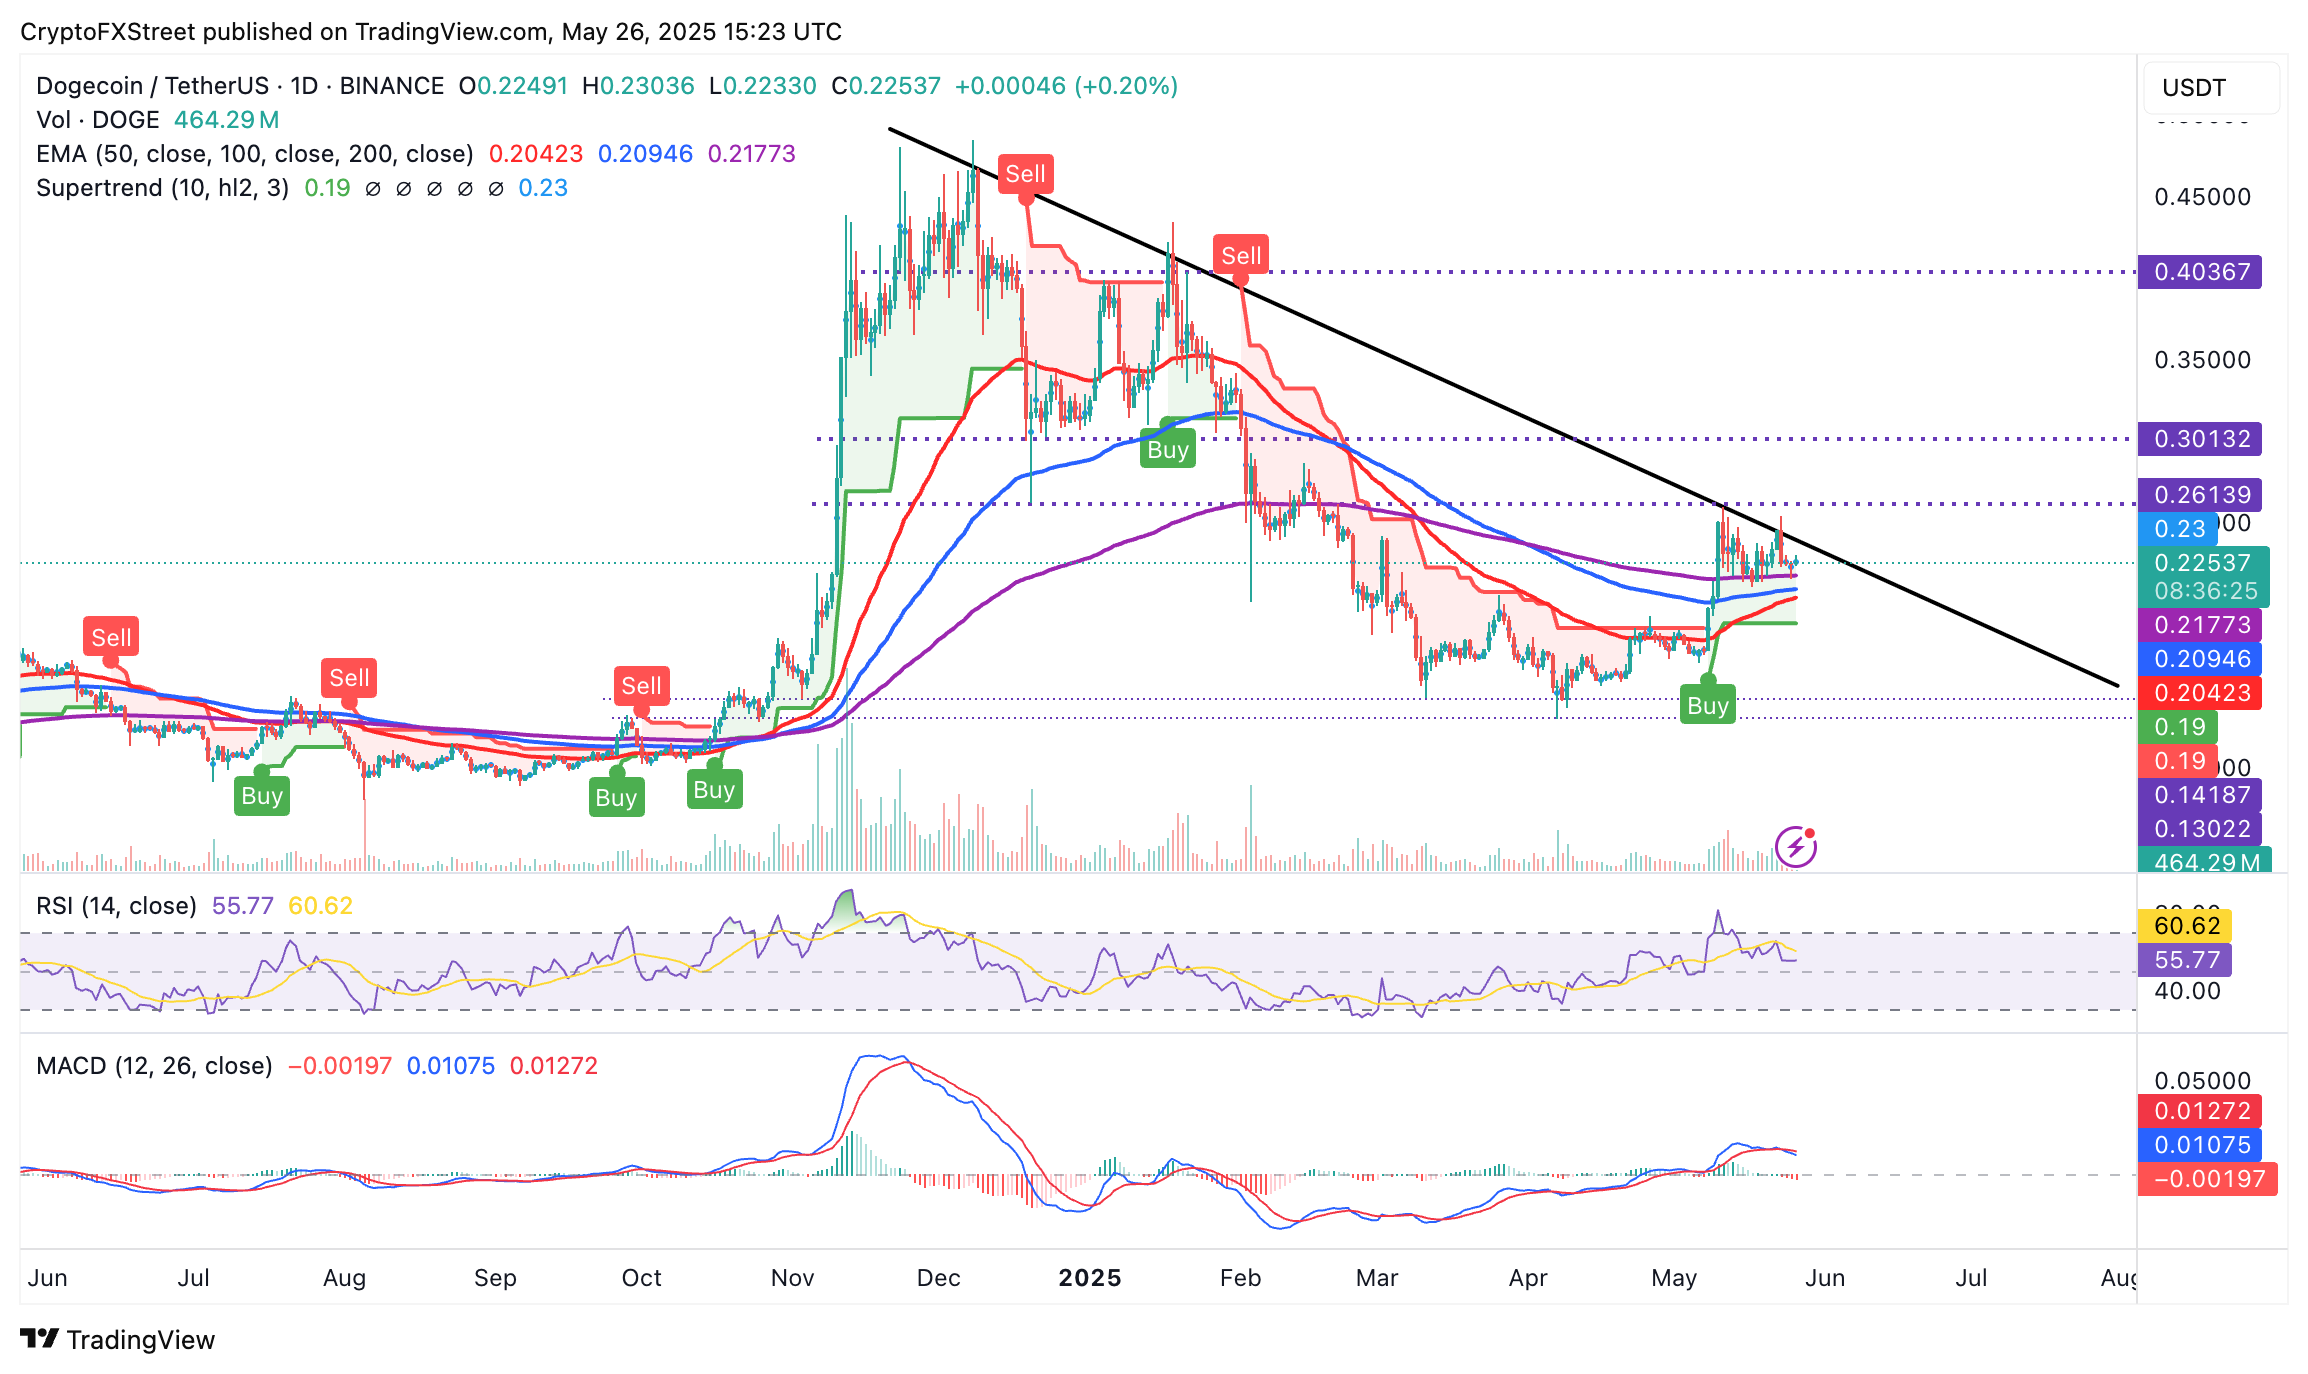
DOGE/USDT daily chart
The persistent decline in the Relative Strength Index (RSI) to 55 from recently overbought levels hints at a strong bearish trend. If selling pressure overwhelms demand and Dogecoin loses key support areas such as the 200-day EMA at $0.21, the RSI could slide below the 50 midline, significantly increasing the probability of extended losses.
Beyond the 100-day and the 50-day EMAs at around $0.21 and $0.20, respectively, the next area of interest for traders eyeing to buy the dip would be the SuperTrend at $0.19, while key price points in April lie at around $0.14 and $0.13.
On the other hand, Shiba Inu’s price hovers at around $0.00001432 at the time of writing. The meme coin sits below the 12-hour 50-period EMA, offering immediate resistance at $0.00001443 and the 200-period EMA at $0.00001458.
The path with the least resistance could stay downward based on the sell signal confirmed by the Moving Average Convergence Divergence (MACD) indicator. This signal manifests when the blue MACD line crosses beneath the red signal line.
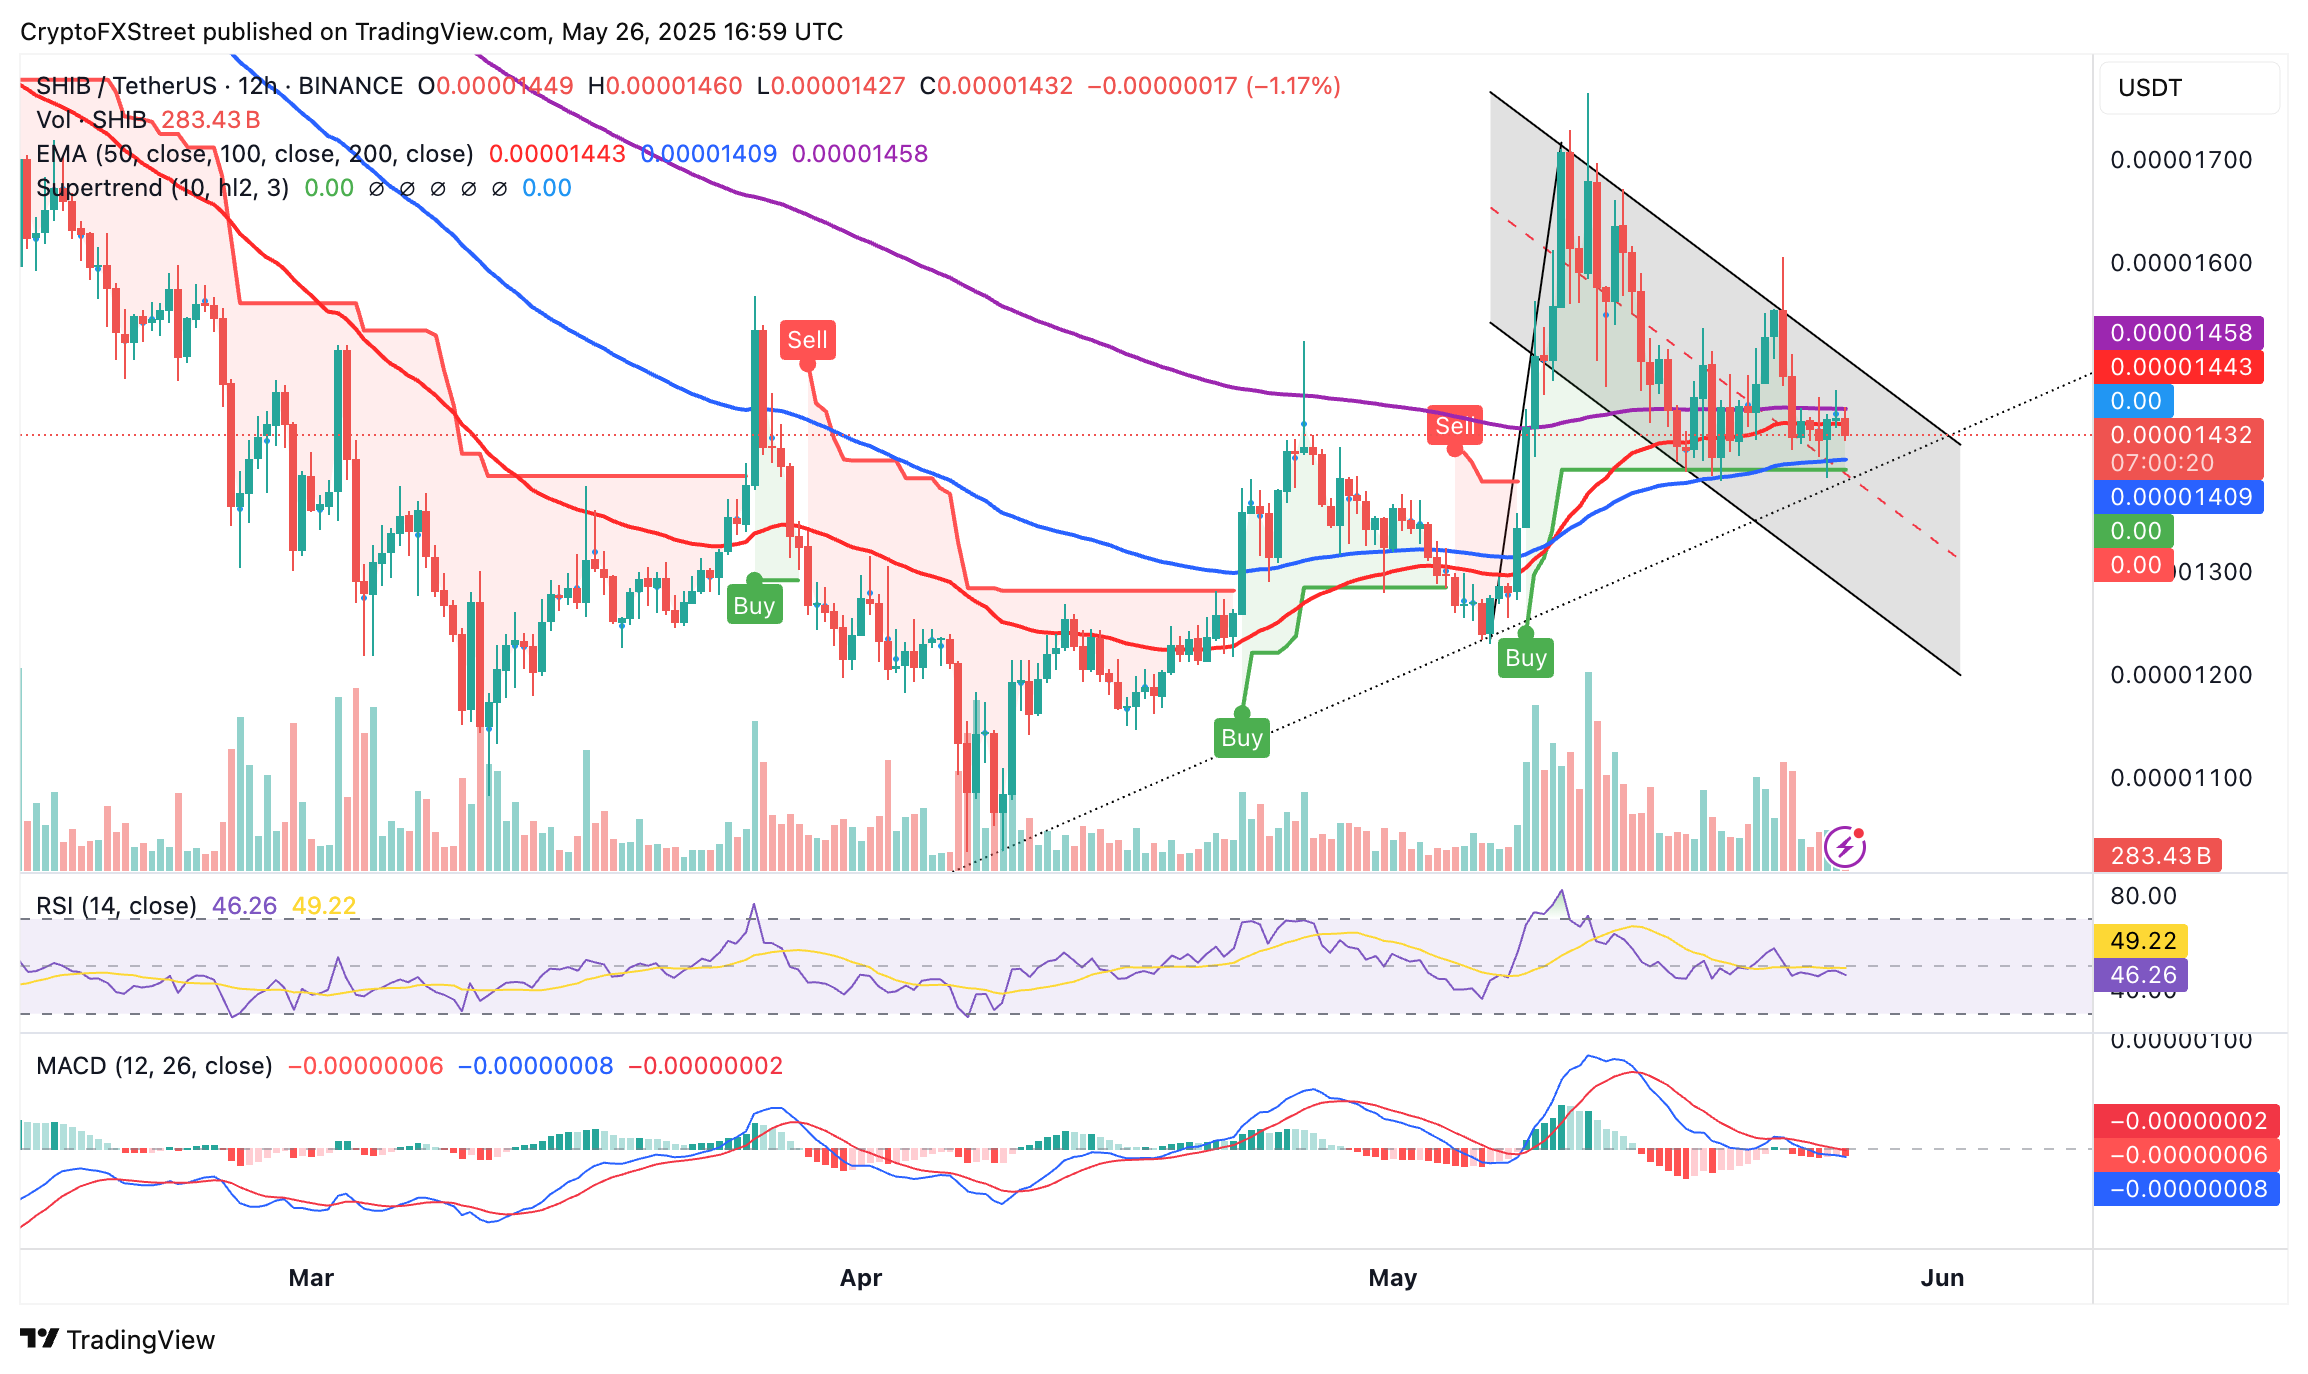
SHIB/USD 12-hour chart
The RSI’s downward trend below the 50 midline signifies a strong downtrend in SHIB, increasing the probability of losses testing the short-term 100-period EMA support at $0.00001409.
Traders eyeing dips could be interested in areas beyond the 100-period EMA, with early May support around $0.00001233 coming into sight, as well as the April 7 low of around $0.00001030.
Cryptocurrency prices FAQs
Token launches influence demand and adoption among market participants. Listings on crypto exchanges deepen the liquidity for an asset and add new participants to an asset’s network. This is typically bullish for a digital asset.
A hack is an event in which an attacker captures a large volume of the asset from a DeFi bridge or hot wallet of an exchange or any other crypto platform via exploits, bugs or other methods. The exploiter then transfers these tokens out of the exchange platforms to ultimately sell or swap the assets for other cryptocurrencies or stablecoins. Such events often involve an en masse panic triggering a sell-off in the affected assets.
Macroeconomic events like the US Federal Reserve’s decision on interest rates influence crypto assets mainly through the direct impact they have on the US Dollar. An increase in interest rate typically negatively influences Bitcoin and altcoin prices, and vice versa. If the US Dollar index declines, risk assets and associated leverage for trading gets cheaper, in turn driving crypto prices higher.
Halvings are typically considered bullish events as they slash the block reward in half for miners, constricting the supply of the asset. At consistent demand if the supply reduces, the asset’s price climbs.
Author

John Isige
FXStreet
John Isige is a seasoned cryptocurrency journalist and markets analyst committed to delivering high-quality, actionable insights tailored to traders, investors, and crypto enthusiasts. He enjoys deep dives into emerging Web3 tren


