Top Crypto Losers: AXS, KAIA, and XMR extend losses as Bitcoin drops below $90,000
- Axie Infinity drops below $2 on Monday, extending the 22% loss from Sunday.
- Kaia is down over 20% in the last 24 hours, risking the 32% gains from Saturday.
- Monero hovers around $450, testing the 100-day EMA after a 21% drop last week.

The altcoins market is facing intense selling pressure with Axie Infinity (AXS), Kaia (KAIA), and Monero (XMR) leading the decline over the last 24 hours as Bitcoin (BTC) extends losses below $90,000. Monero’s decline reflects a loss of steam in the privacy narrative, while Axie Infinity’s pullback suggests a sudden reversal in interest in gaming tokens. Technically, the AXS, KAIA, and XMR altcoins remain vulnerable to further losses.
Bitcoin, on the other hand, trades near $88,000 at the time of writing on Monday, recovering over 1% on the day after a nearly 3% decline on Sunday. The rebound in BTC from the ascending trend line connecting the November 22 and December 18 lows near $83,500 maintains the larger expanding channel on the daily chart. BTC would need a close above $90,000 to ease selling pressure, with the 50-day Exponential Moving Average (EMA) at 91,474 acting as initial resistance.
Bitcoin sits beneath the 50-, 100-, and 200-day EMAs, preserving a bearish stack. The 50-day EMA at $91,474 remains below the 100-day EMA at $94,934, while the 200-day EMA at $98,628 slopes down, capping recovery attempts.
The Moving Average Convergence Divergence (MACD) shows the MACD line below the Signal line and both below zero, with a widening negative histogram pointing to strengthening bearish momentum. At the same time, the Relative Strength Index (RSI) stays under the midline at 40, indicating weak demand without an oversold signal.
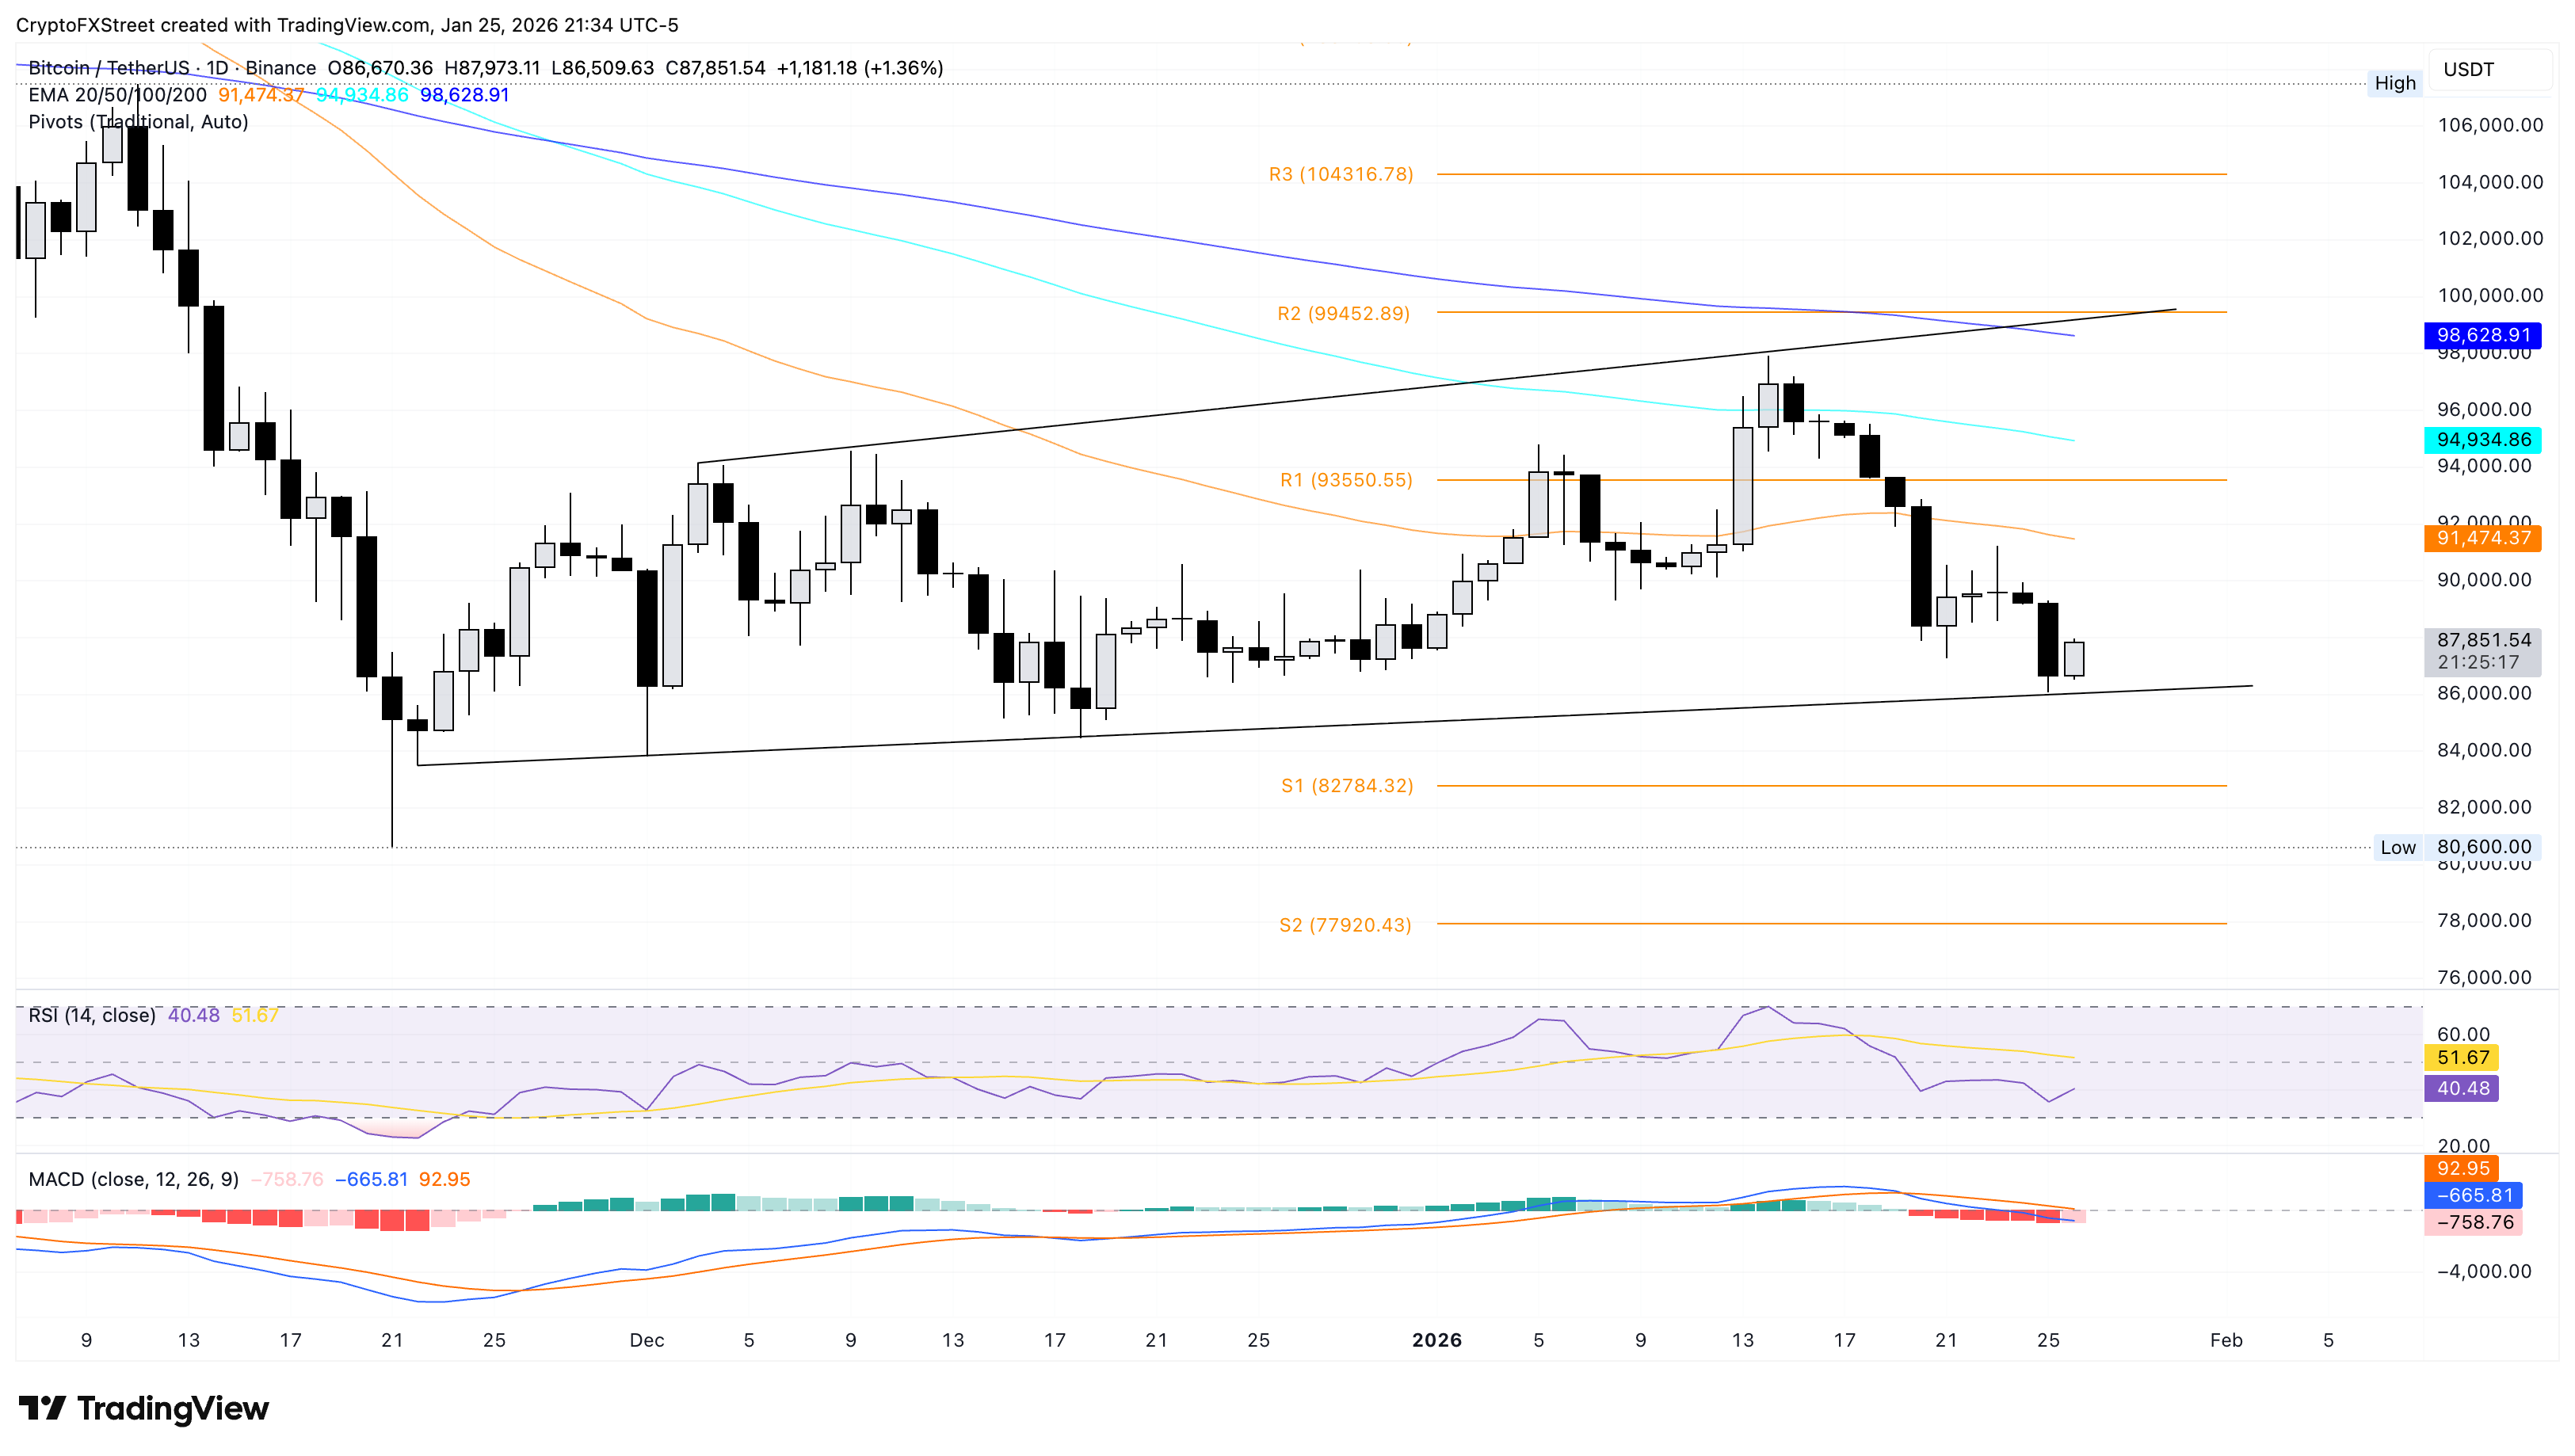
If Bitcoin fails to hold above the support trendline near $83,500, the S1 Pivot Point at $82,784 would remain the initial support.
Axie Infinity falls toward the 200-day EMA
Axie Infinity trades below $2 at press time on Monday, recording nearly 4% loss on the day. The gaming token records its third consecutive day of losses, extending the 22% decline from Sunday.
AXS approaches the 200-day EMA at $1.79 as the nearest support after breaching the 50% retracement level at $2.23, measured from the May 14 high at $3.70 to the December 17 low at $0.75.
The MACD crosses the signal line on the daily chart, signaling a loss of bullish momentum and raising the risk of a crossover that could confirm the bearish shift. Meanwhile, the RSI at 56 dips from the overbought zone into the neutral zone, corroborating the demand loss.
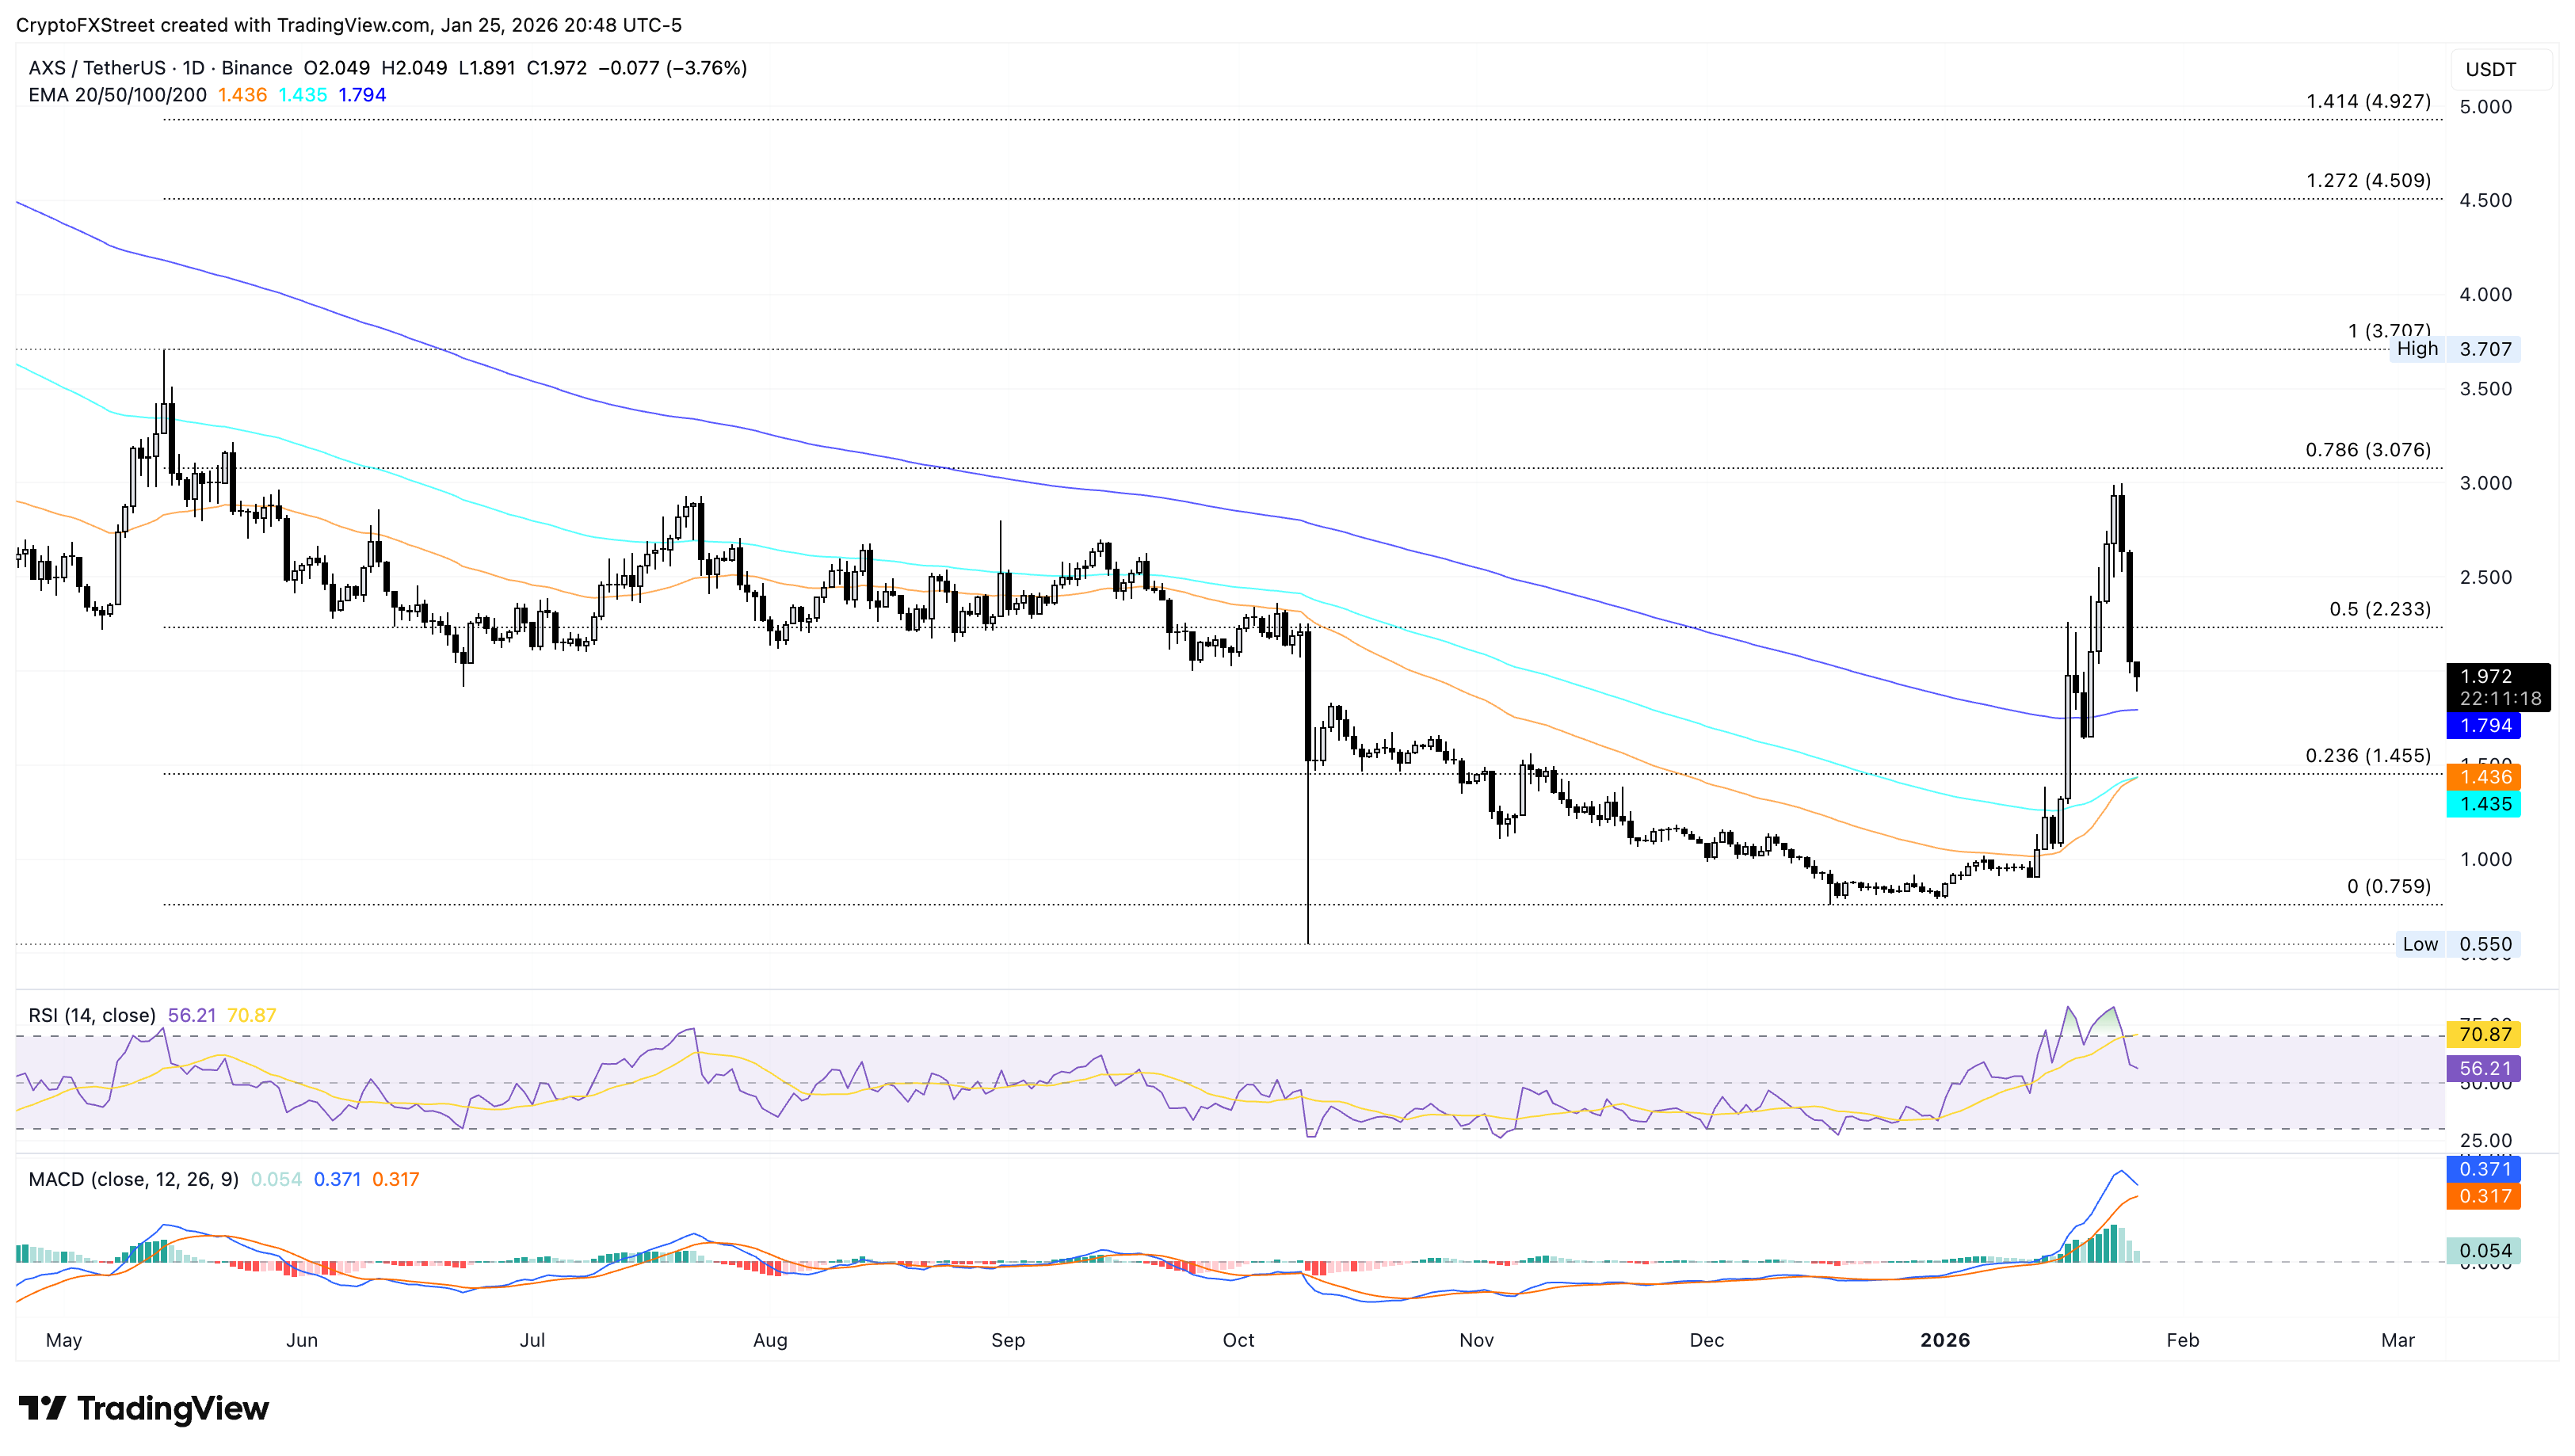
A potential rebound in AXS from the 200-day EMA at $1.79 could test the overhead resistance at $2.23.
Kaia flags downside risk toward a key psychological support
Kaia is down 6% at the time of writing on Monday, extending the 18% decline from Sunday. The pullback in KAIA risks erasing the 32% gains from Saturday with a close below the R1 Pivot Point at $0.0735.
The 50-day EMA at $0.0678 remains a key level, limiting downside risk and providing support for a bounce back. A potential rebound in KAIA would need to surpass the 100-day EMA at $0.0804 to reclaim upward momentum.
The RSI is at 55 on the daily chart, indicating a neutral shift from a high-demand phase, while the MACD and signal line turn flat above zero, suggesting residual bullish momentum.
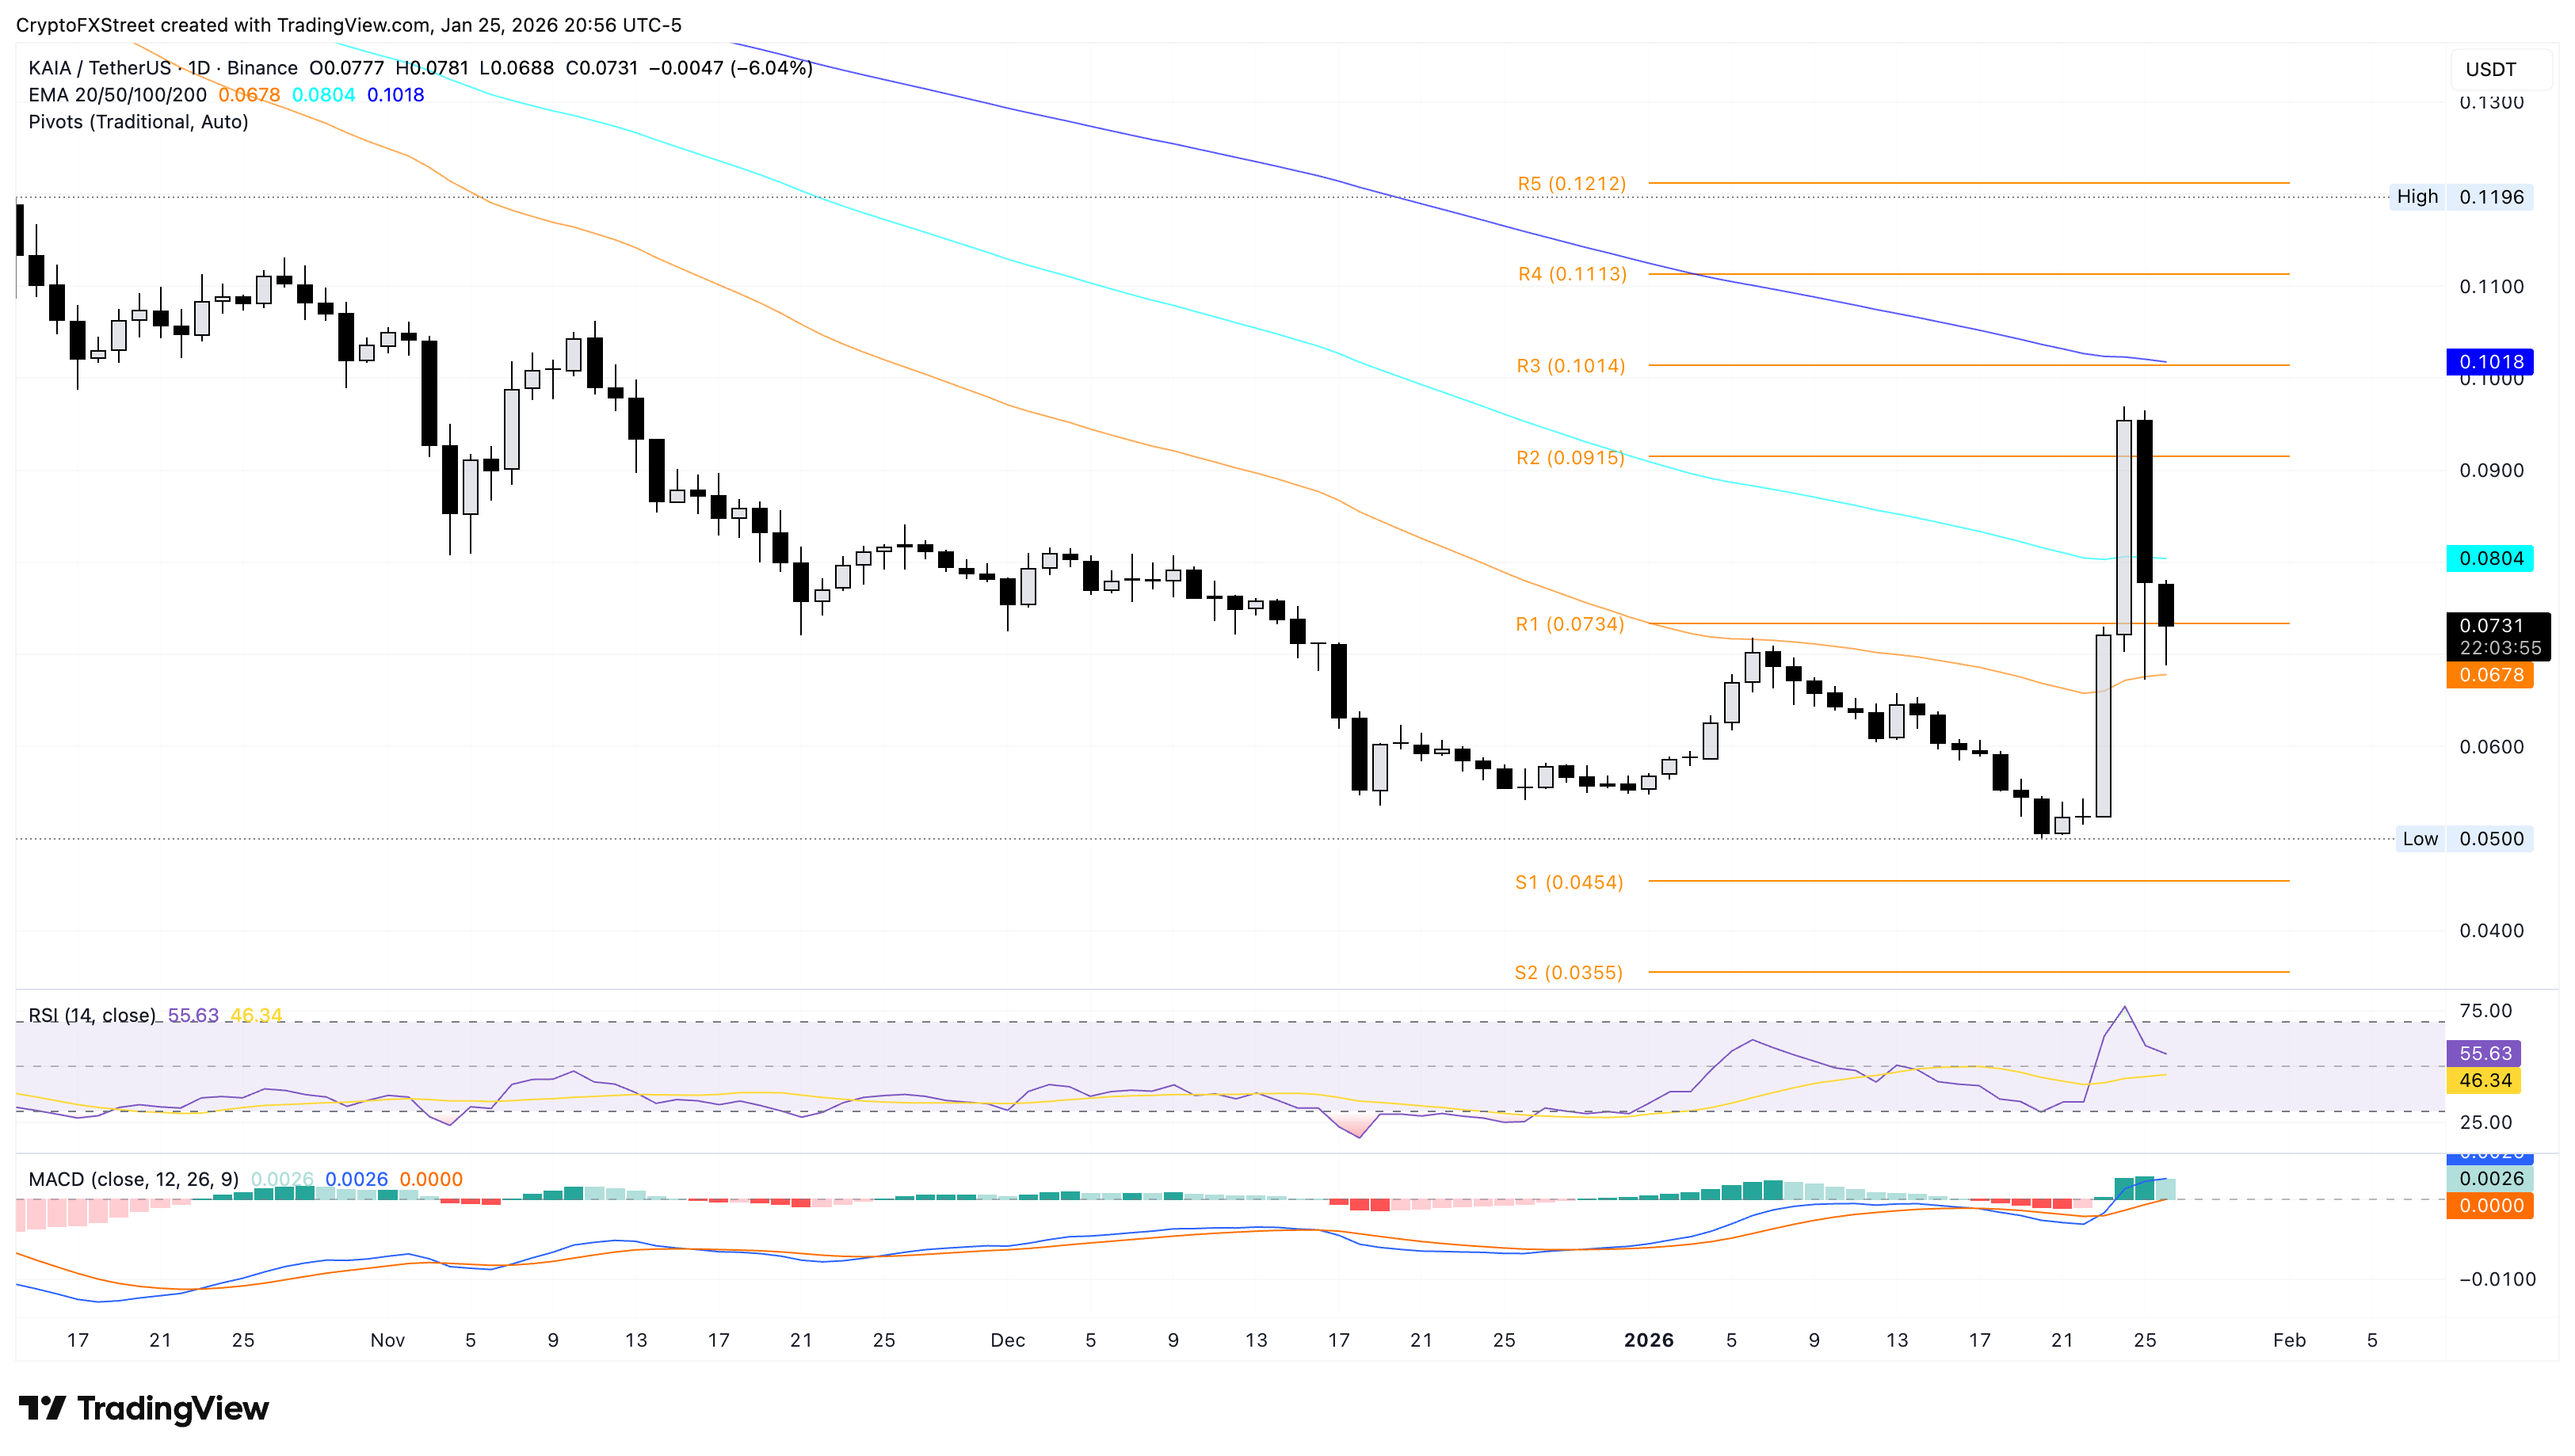
However, if KAIA closes below $0.0678, it could risk a revisit to the $0.0500 psychological support level.
Monero tests the 100-day EMA support
Monero is trading below $500 after a 21% drop last week, suggesting reduced demand for the privacy coin. At the time of writing, XMR hovers around $450 on Monday, stabilizing above the 100-day EMA at $437, after a 10% drop on Sunday. Meanwhile, the 200-day EMA at $383 remains the primary trend floor.
The MACD line stays below the signal with both falling toward the zero line as histogram bars expand negatively, flagging firm bearish momentum. At the same time, the RSI at 41 indicates a neutral-to-bearish shift as sellers retain the near-term edge without oversold conditions.
A close beneath the 100-day EMA at $437 could expose the 200-day EMA at $383.
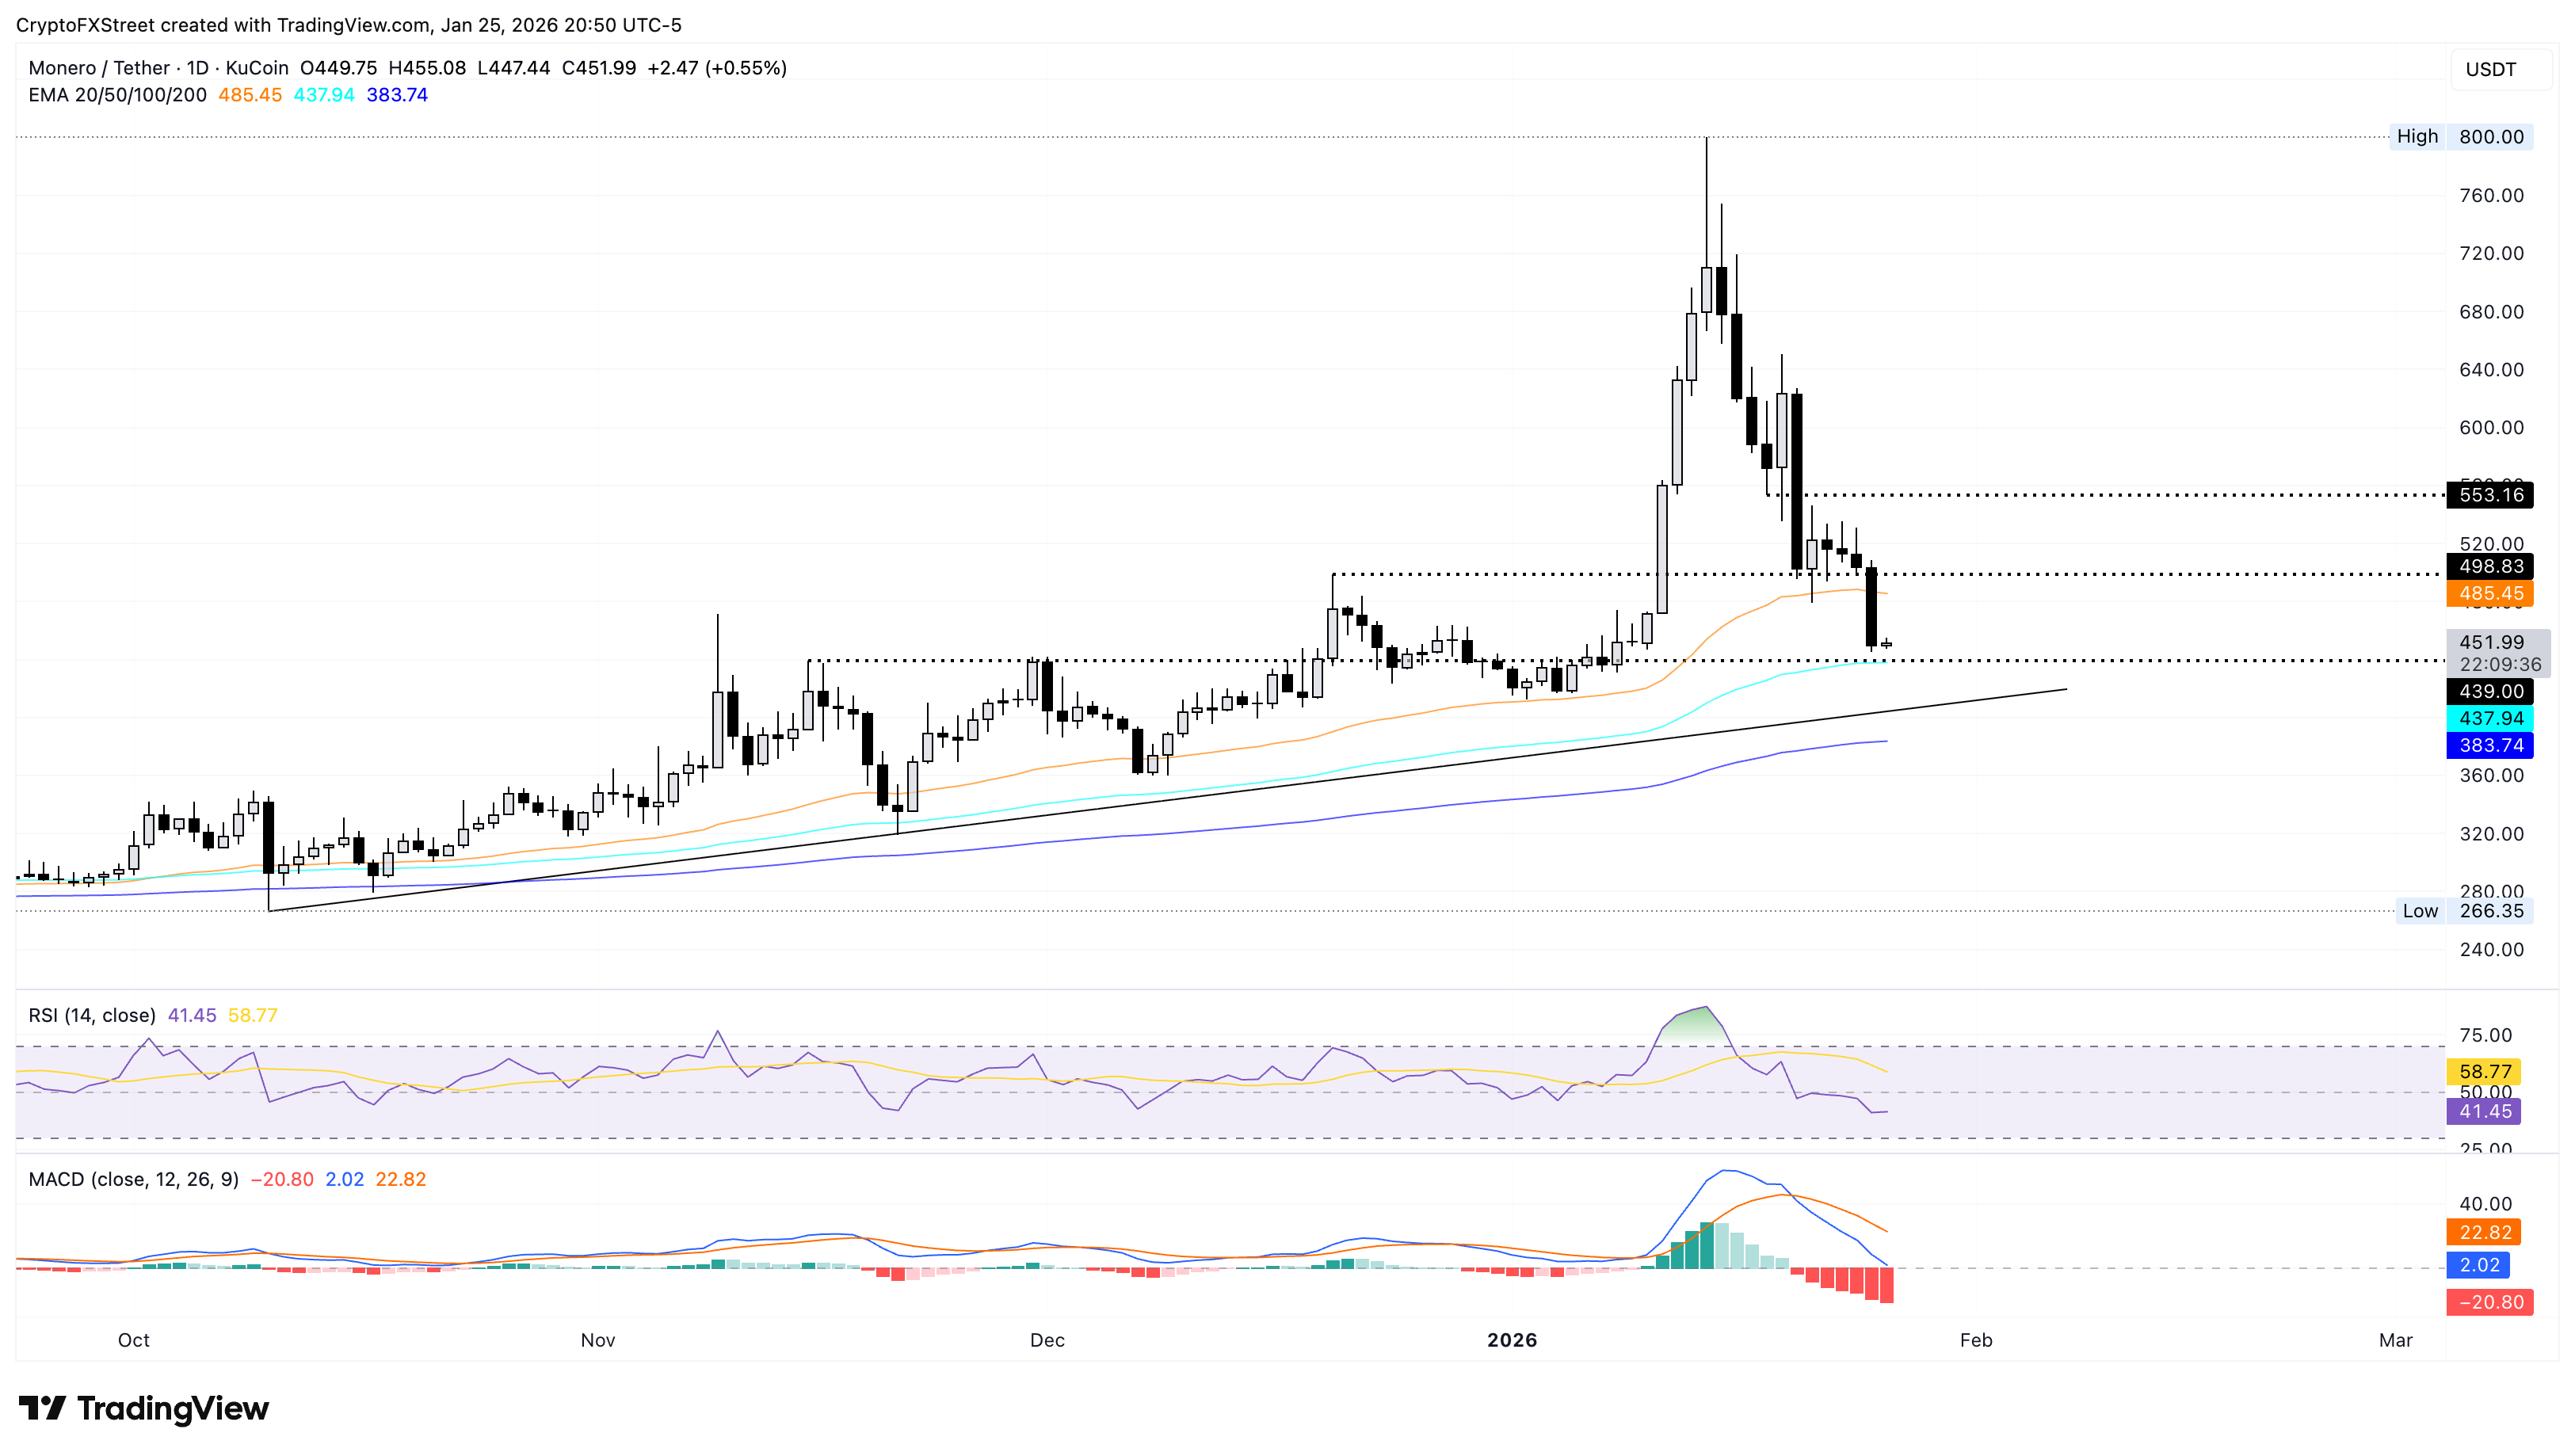
On the upside, a potential recovery above the 50-day EMA at $485 would alleviate pressure and refocus recovery above $500.
(The technical analysis for Bitcoin and Monero was written with the help of an AI tool.)
Author

Vishal Dixit
FXStreet
Vishal Dixit holds a B.Sc. in Chemistry from Wilson College but found his true calling in the world of crypto.


