Top Crypto Gainers: Hedera, Flare, Ripple – HBAR, FLR, XRP make waves with double-digit gains
- Hedera edges higher by nearly 4% to reach a five-month high, with bulls targeting $0.32.
- Flare trendline breakout rally records a 16% surge on Thursday, signaling a potential trend reversal.
- Ripple appreciates over 3%, extending the double-digit gains from the previous day.

Hedera (HBAR), Flare (FLR), and Ripple (XRP) continue to extend their double-digit gains from Thursday, outperforming the broader market over the last 24 hours. The surge in altcoins aligns with Bitcoin (BTC) reclaiming the $120,000 level and an improvement in broader market sentiment. The technical outlook suggests a bullish inclination, as rising buying pressure fuels trend momentum.
Hedera eyes further gains amid increasing TVL
Hedera edges higher by nearly 4% at press time on Friday, extending the 17% gains from Thursday. The altcoin hits a five-month record high, testing the $0.30 mark.
HBAR bulls target the $0.32 resistance last tested on January 26. A closing above this level could stretch the uptrend to the $0.37 level, marked by the high of December 6.
The 50-day and 200-day Exponential Moving Averages (EMAs) signal a Golden Cross, indicating a trend reversal. Technically, it is considered a strong buy signal as the short-term trend overpowers the longer-term decline.
The Moving Average Convergence/Divergence (MACD) indicator displays a rising trend in the green histogram bars, suggesting increased bullish momentum.
The Relative Strength Index (RSI) reads 85, indicating extremely overbought conditions. Sidelined investors must remain cautious as the buying pressure inches closer to saturation levels.
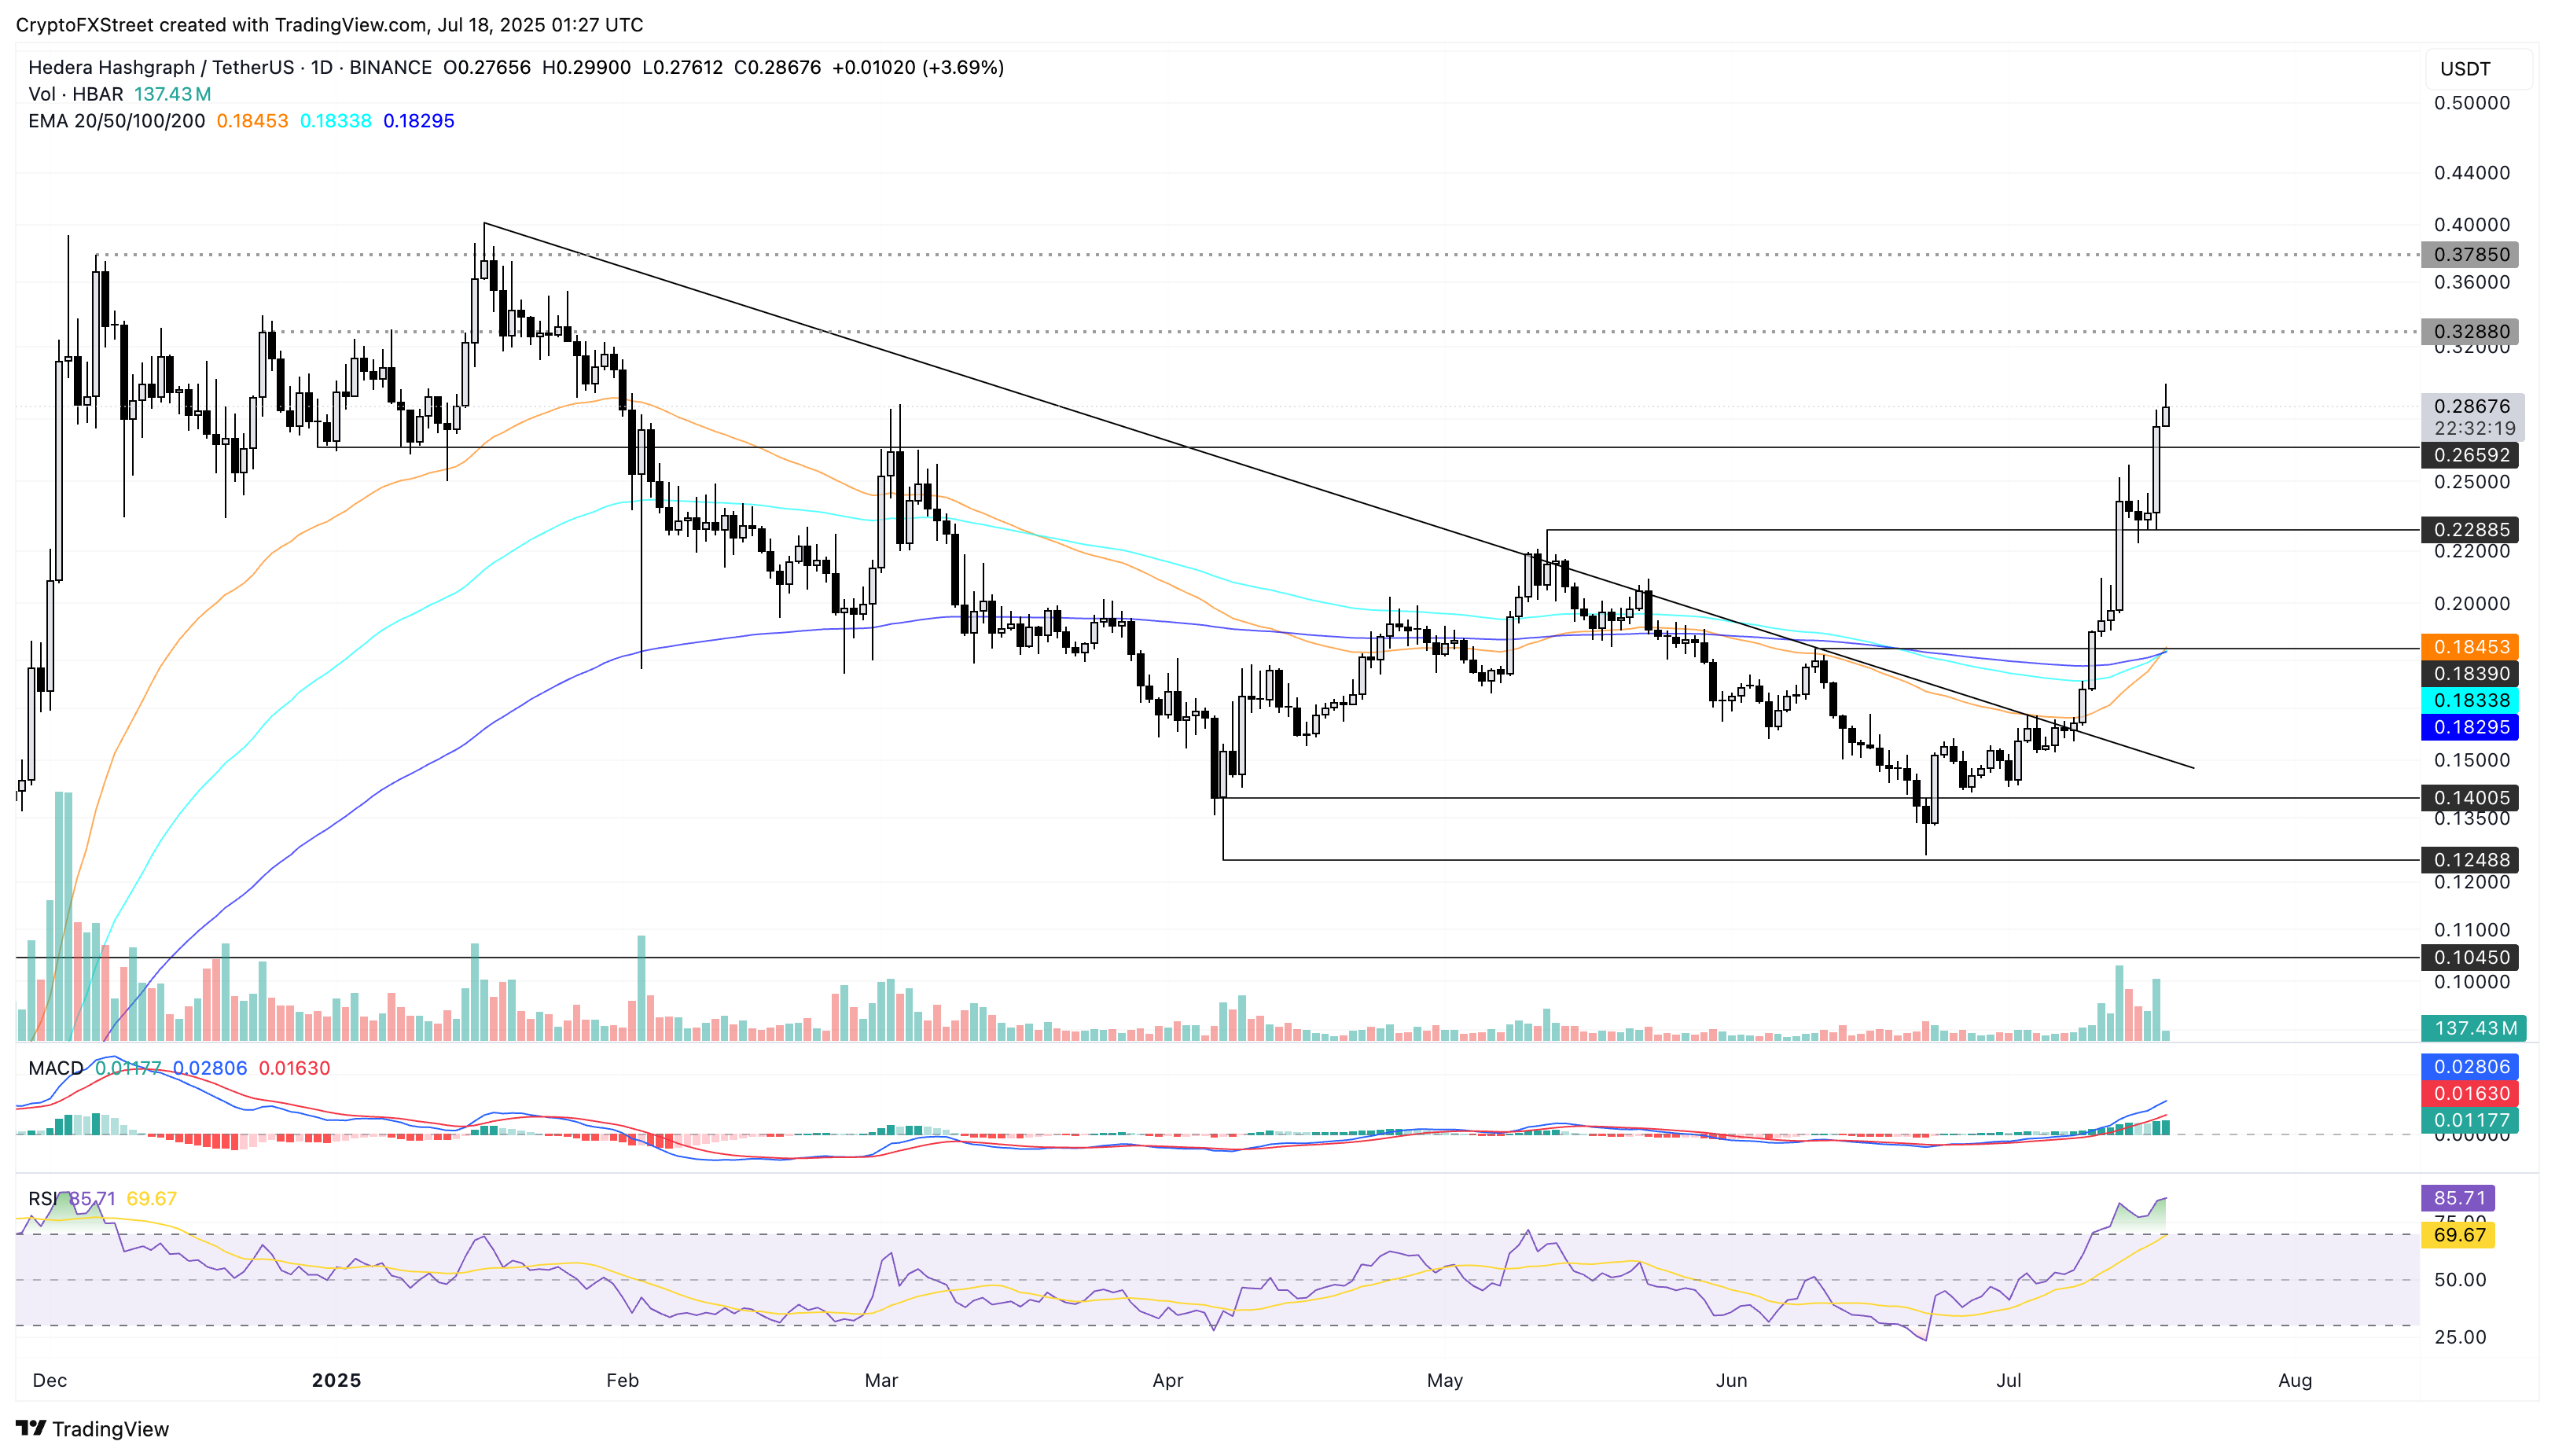
HBAR/USDT daily price chart.
Total Value Locked (TVL) on Hedera refers to the US Dollar value of the assets deposited on the network. At the time of writing, the Hedera TVL stood at $129.15 million, up from $73.48 million on July 1.
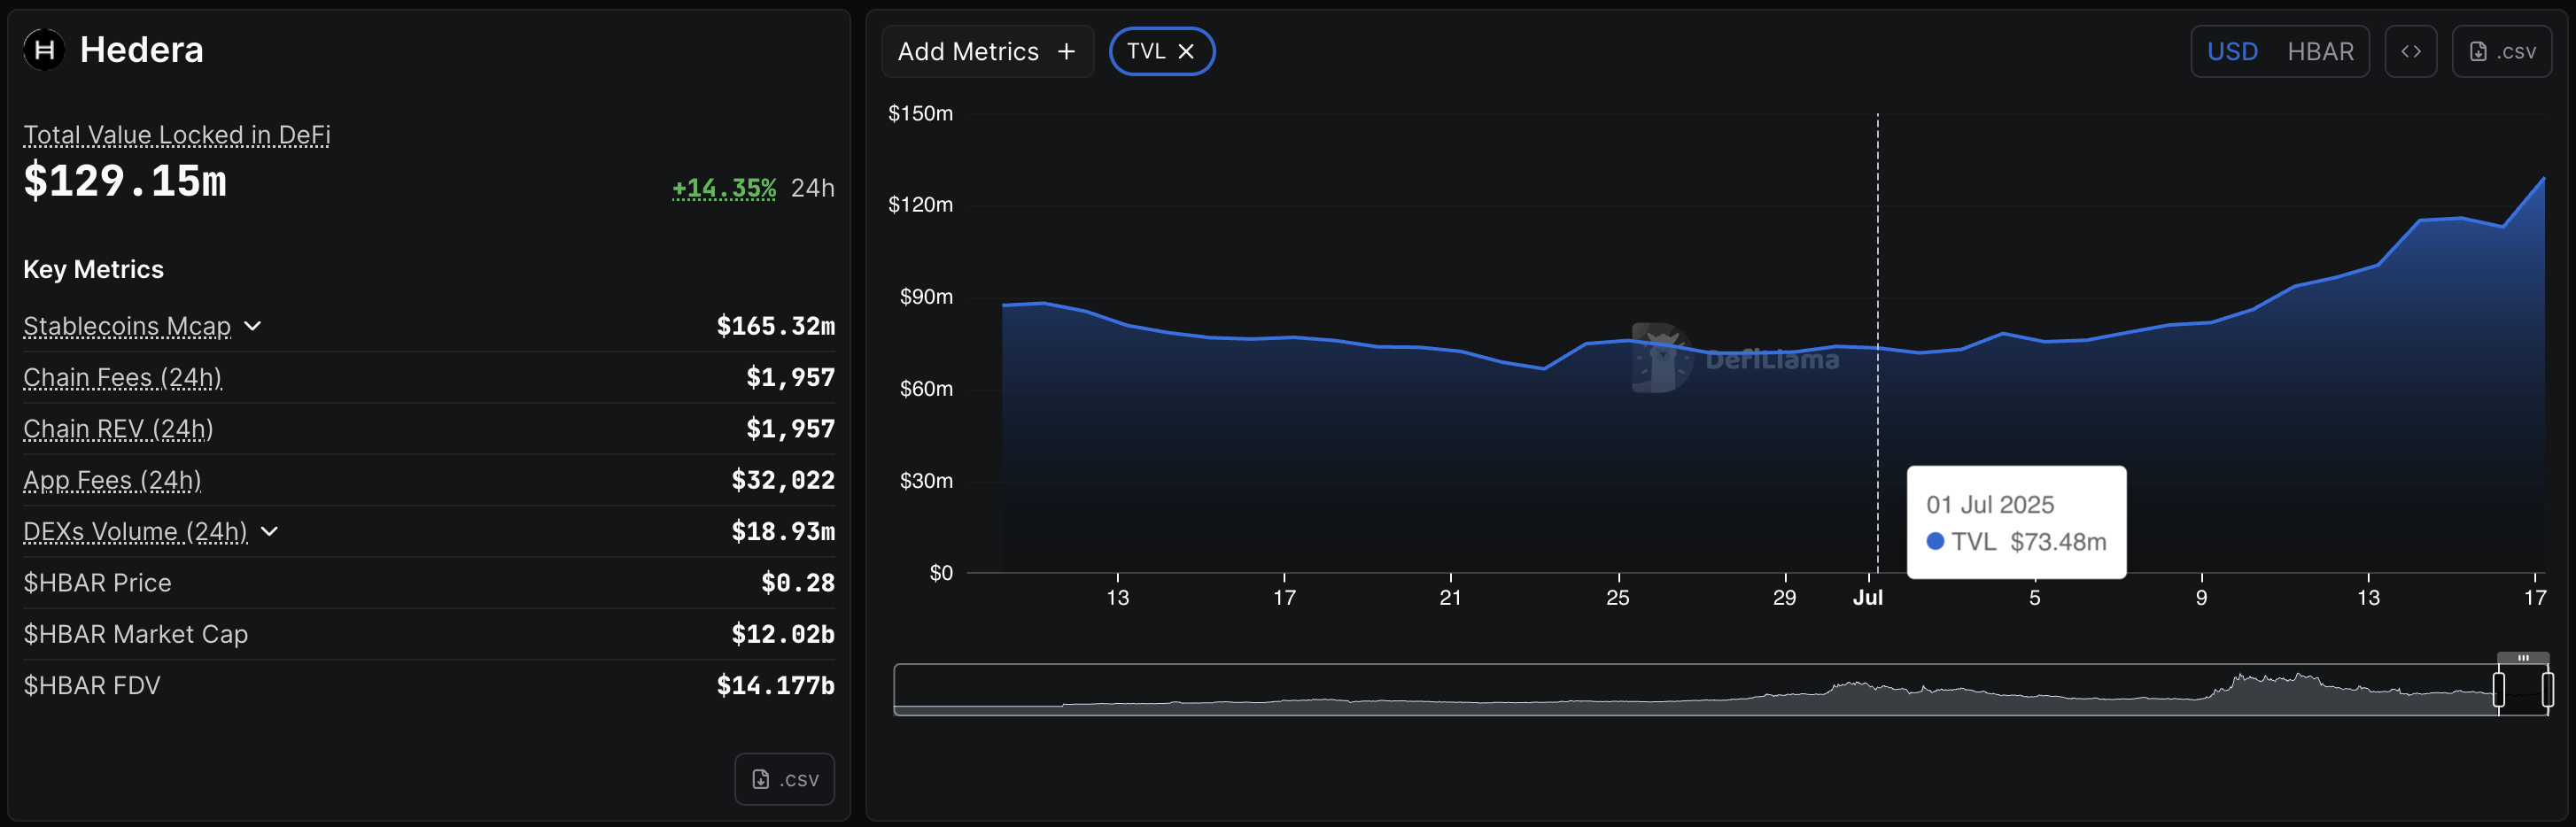
Hedera TVL. Source: Coinglass
On the downside, a reversal below the $0.26 level could extend the declining trend to the $0.22 support level, marked by the high of May 12.
Flare extends the trendline breakout rally
Flare edges higher by 3% as it holds to the 16% gains from Thursday, printing its sixth consecutive bullish candle. A resistance trendline breakout rally in Flare exceeds the 50% Fibonacci retracement level at $0.01982, drawn from the $0.03514 peak of December 3 to the $0.1118 low of April 8.
The bullish run targets the 78.6% Fibonacci level at $0.02750, hinting at double-digit gains.
The indicators suggest increased bullish momentum, as the MACD and signal line surge above the zero line, accompanied by rising green histogram bars, and the RSI reads 80 (overbought), indicating increased buying pressure.
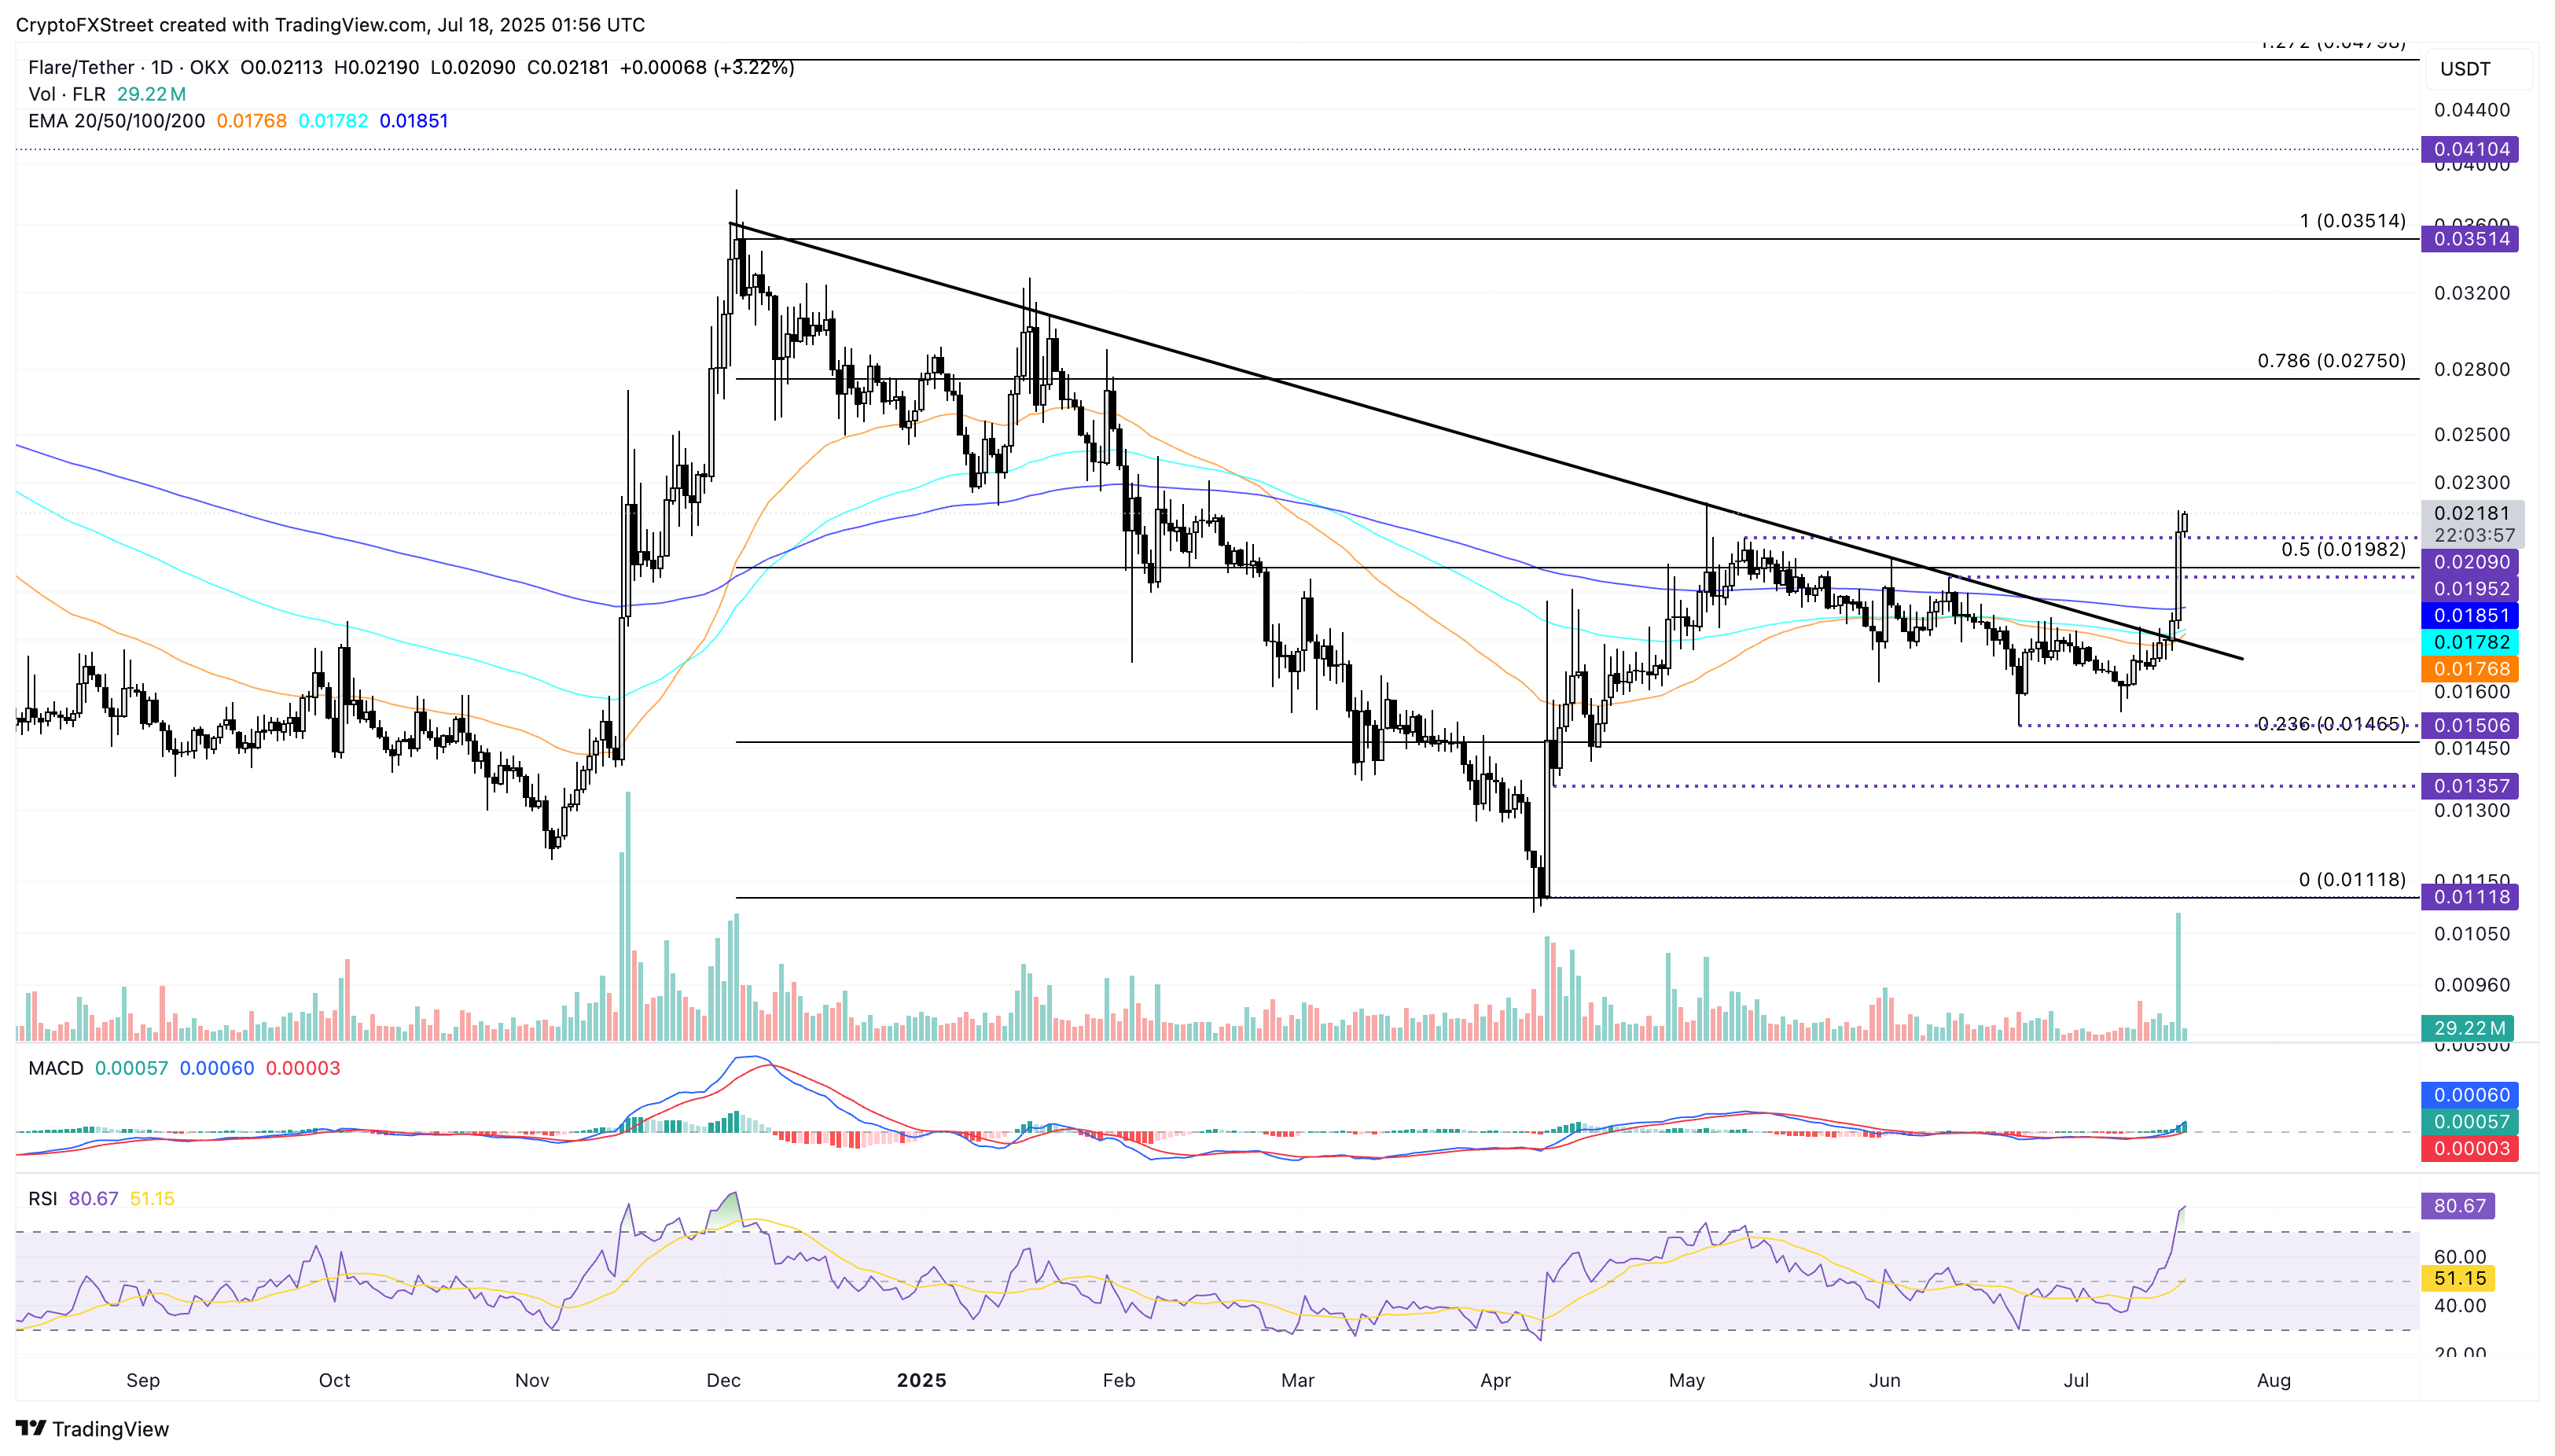
FLR/USDT daily price chart.
However, if FLR falls below $0.01982, it could retest the 200-day EMA at $0.01851.
Ripple hits a record high amid increasing bullish momentum
Ripple trades in the green by over 3% on the day, adding gains over the 14% rise from Thursday. XRP has reached a record all-time high, entering a price discovery mode.
XRP bulls could target the 1.272 Fibonacci retracement level at $3.88, drawn from the $3.40 peak of January 16 to the $1.61 low of April 7.
The RSI indicator reads 89 (overbought), indicating extreme buying pressure that is approaching saturation levels. Still, the MACD indicator displays a steady uptrend in the green histogram bars, pointing to increasing bullish momentum.
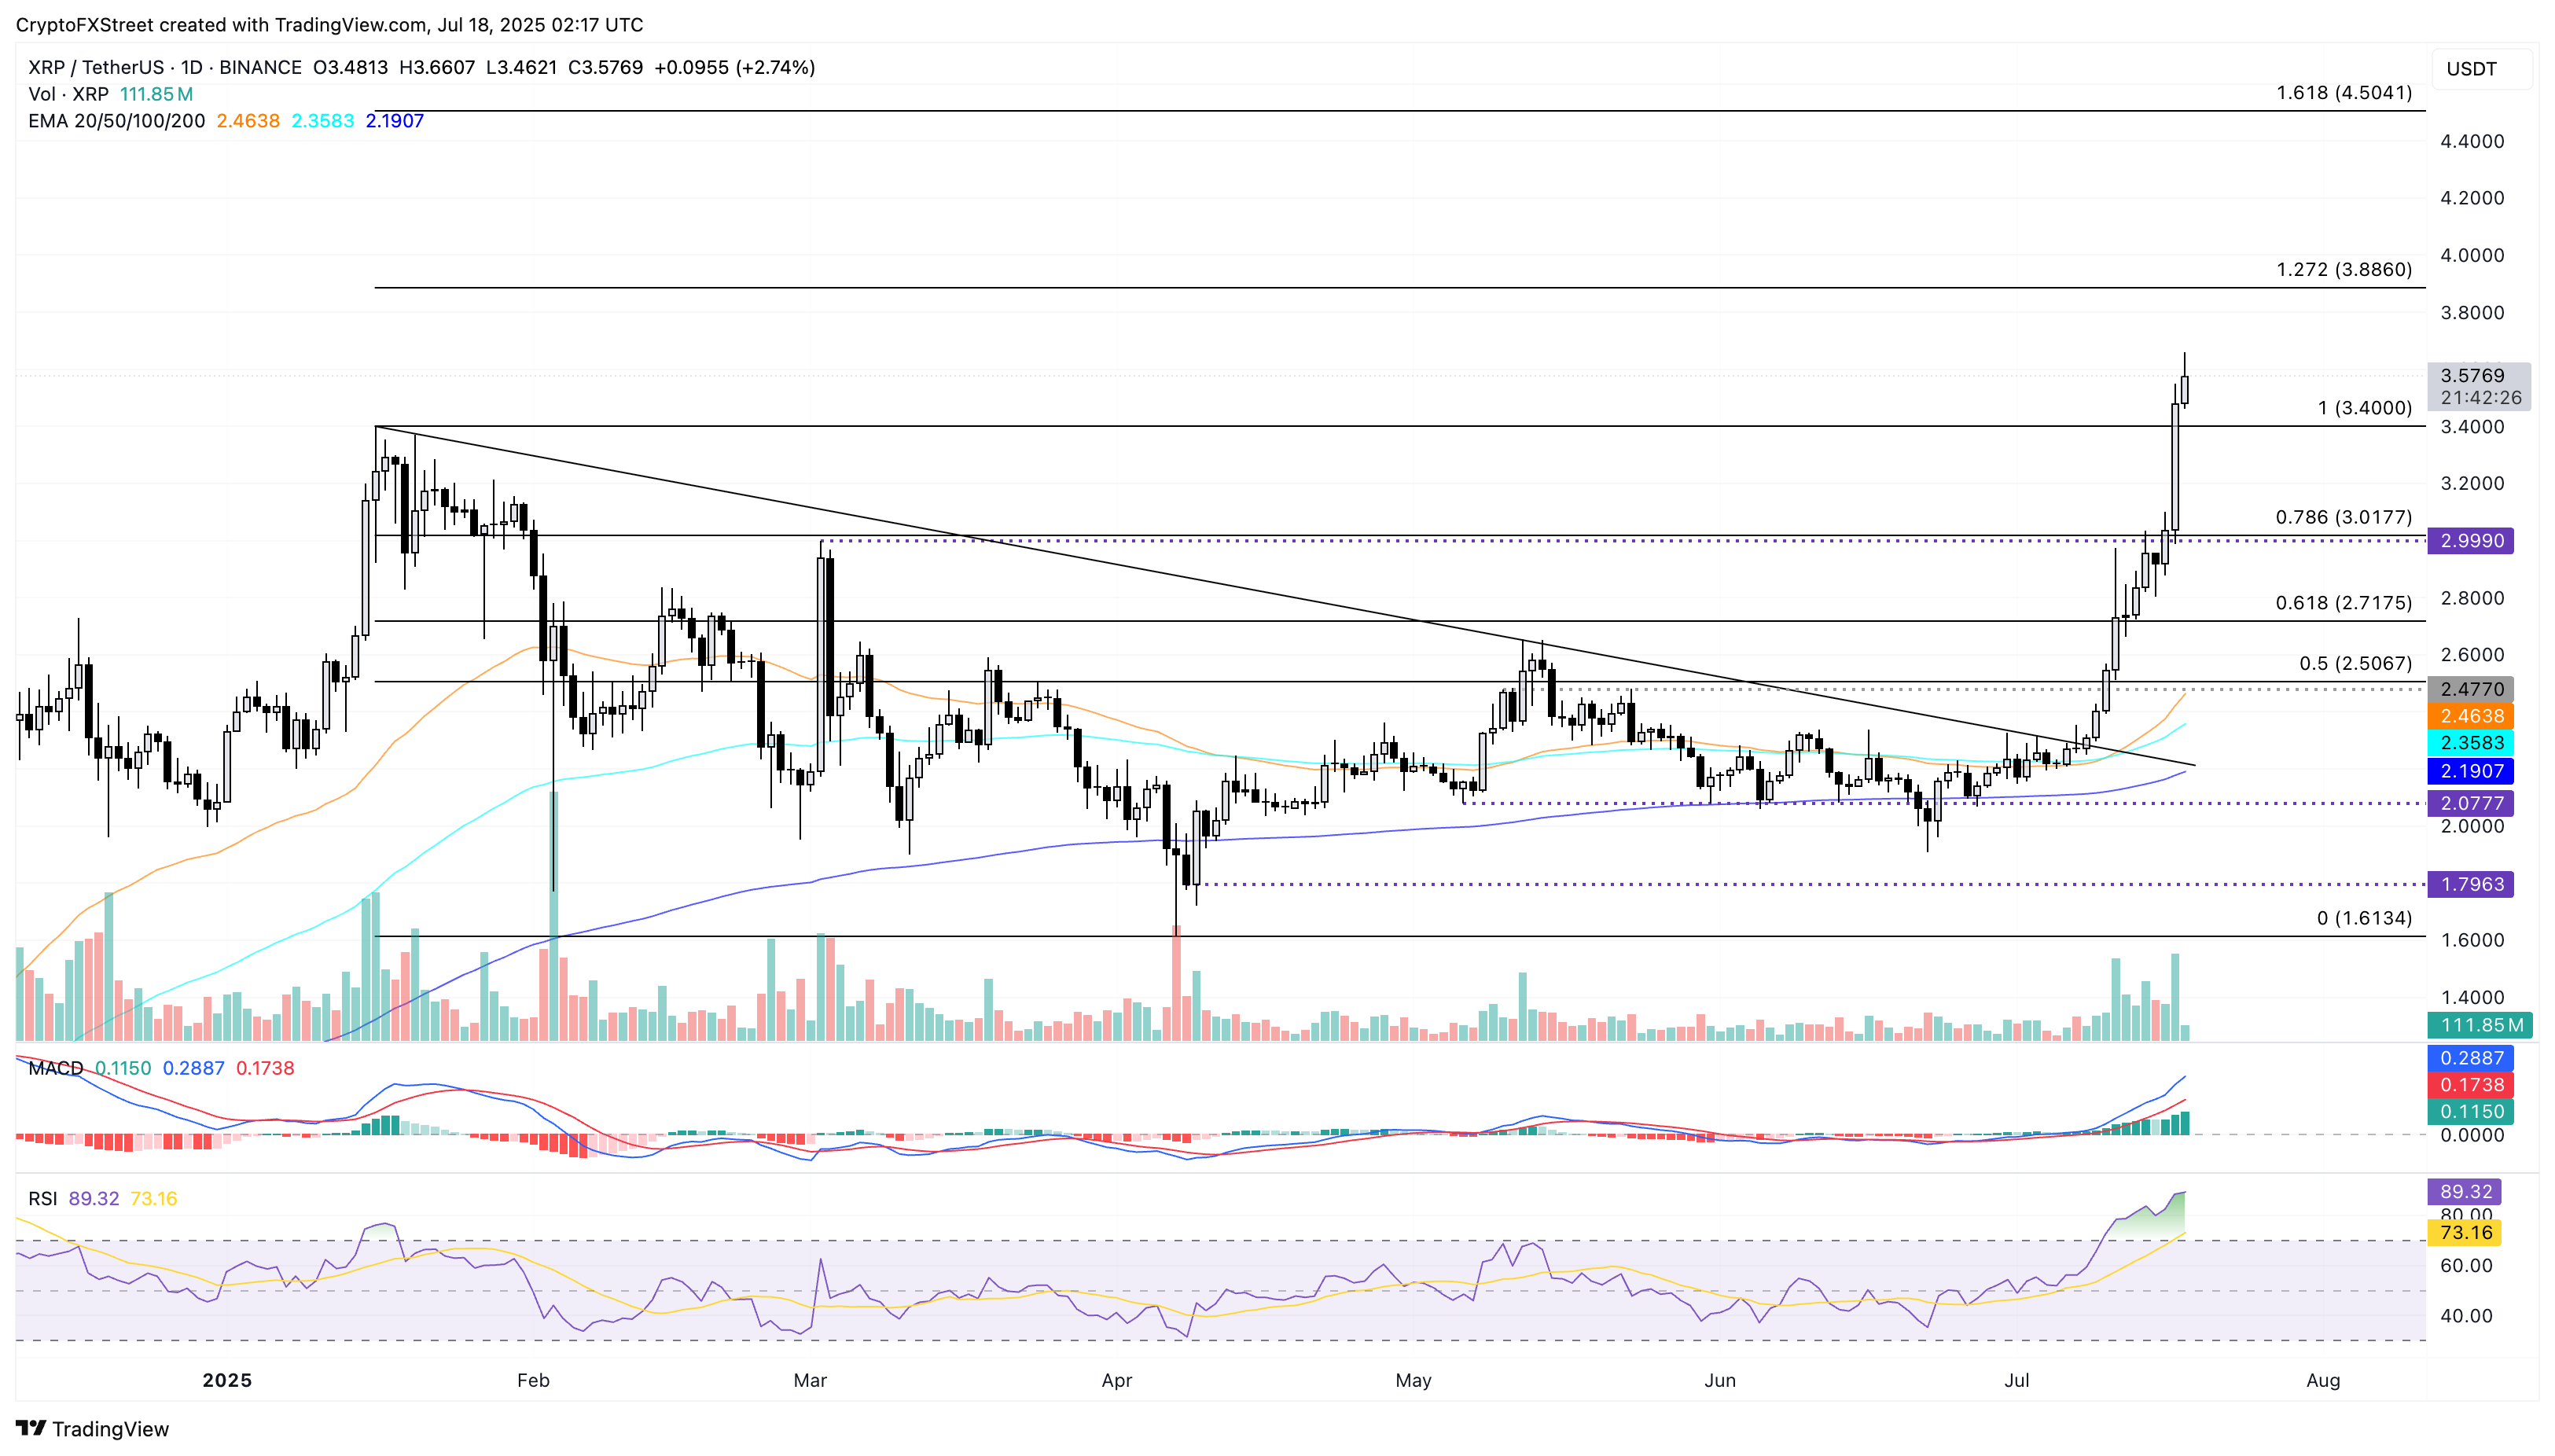
XRP/USDT daily price chart.
The bullish run could be driven by the expanding XRPL EVM Sidechain, which has seen over 1,300 smart contracts deployed, with more than 160 tokens already launched, and over 17,000 new addresses, as previously reported by FXStreet.
On the downside, a reversal in Ripple could retest the $3.40 level marked on January 16.
Author

Vishal Dixit
FXStreet
Vishal Dixit holds a B.Sc. in Chemistry from Wilson College but found his true calling in the world of crypto.


