Top altcoins Solana and Cardano show bearish signs in momentum indicators
- Solana’s price extends its decline on Monday after falling more than 11% in the previous week.
- Cardano’s price trades in red on Monday after correcting over 11% last week.
- The MACD indicator shows a bearish crossover in SOL and ADA, suggesting a continuation of the decline.

Top altcoins Solana (SOL) and Cardano (ADA) extend their correction on Monday after declining more than 11% in the previous week. The technical outlook for both altcoins projects a continuation of the pullback, targeting a double-digit crash ahead as the Moving Average Convergence Divergence (MACD) indicator shows a bearish crossover in SOL and ADA.
Solana bears aim for the $155 mark
Solana price declined more than 11% and closed below the 50% price retracement level at $192.20 (drawn from the November 4 low of $155.11 to the November 22 all-time high of $264.39) last week. On Monday, it continues to trade down around $183.30, approaching its 61.8% Fibonacci retracement level of $175.16.
If SOL closes below $175.16, it could extend the decline by 15% from its current level to retest its November 4 low of $155.11.
The Relative Strength Index (RSI) on the daily chart reads 39, below its neutral level of 50 and points downwards, indicating strong bearish momentum. Additionally, the Moving Average Convergence Divergence (MACD) indicator also shows a bearish crossover on Friday, suggesting a downward trend.
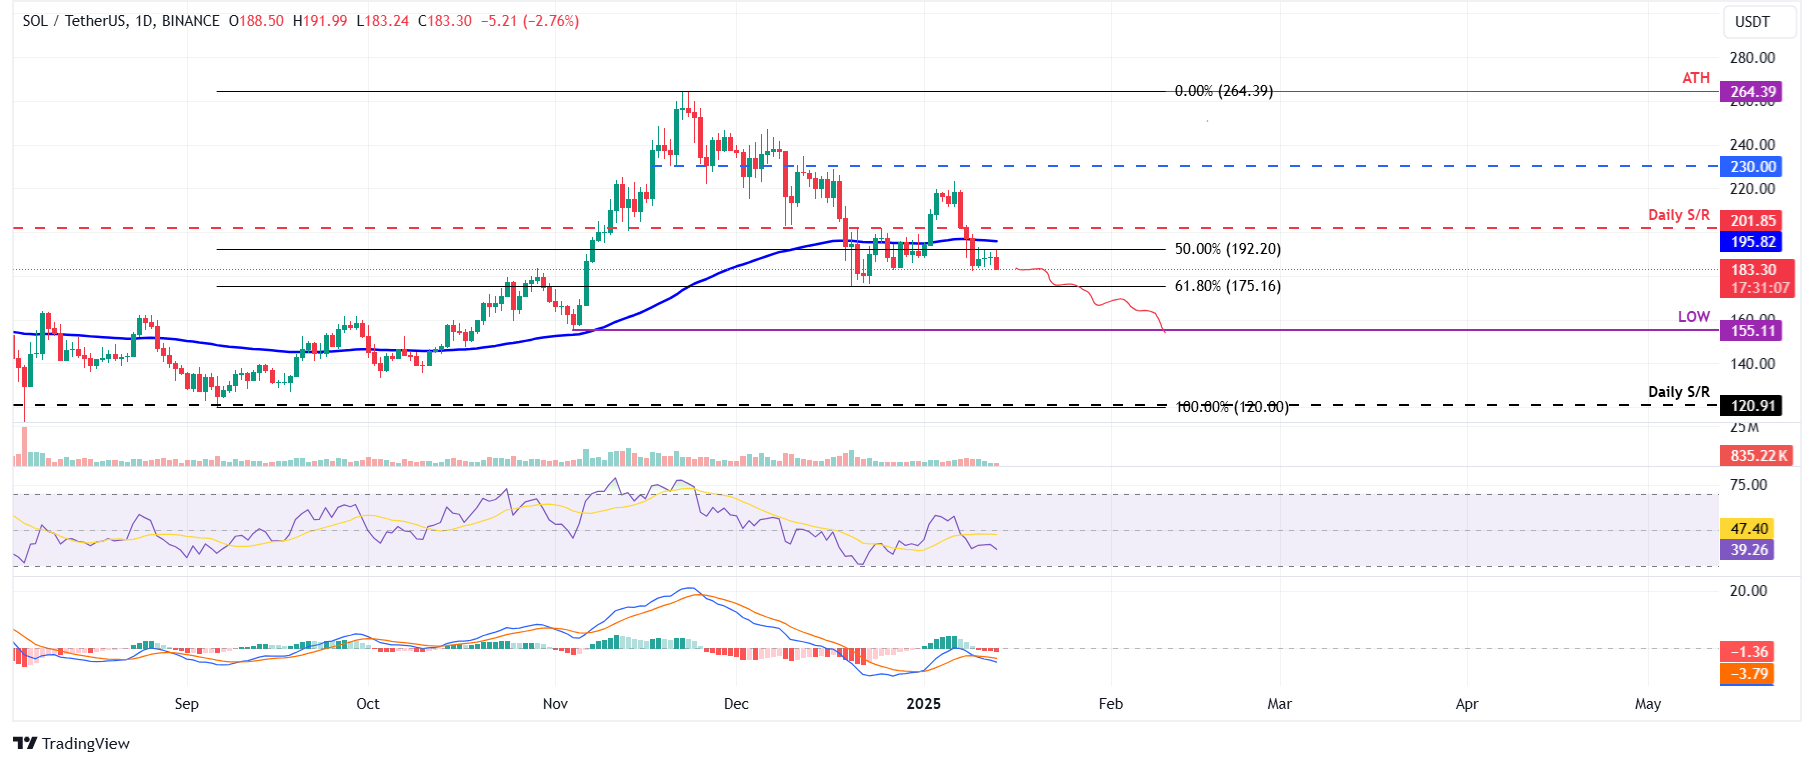
SOL/USDT daily chart
However, if Solana's price recovers and closes above the $201.85 daily resistance level, it could extend the recovery to retest its January 6 high of $223.18.
Cardano price set for a downturn as momentum indicators show bearish signs
Cardano price faced rejection around its weekly resistance level of $1.18 and declined 11.31% in the previous week. At the time of writing on Monday, it continues its correction, trading around $0.94.
If ADA continues its pullback, it could extend the decline by 20% from its current level to retest its next weekly support at 0.74.
The RSI indicator on the daily chart reads 48, below its neutral level of 50 and points downwards, indicating bearish momentum. Additionally, the MACD also shows a bearish crossover on Sunday, suggesting a downward trend.
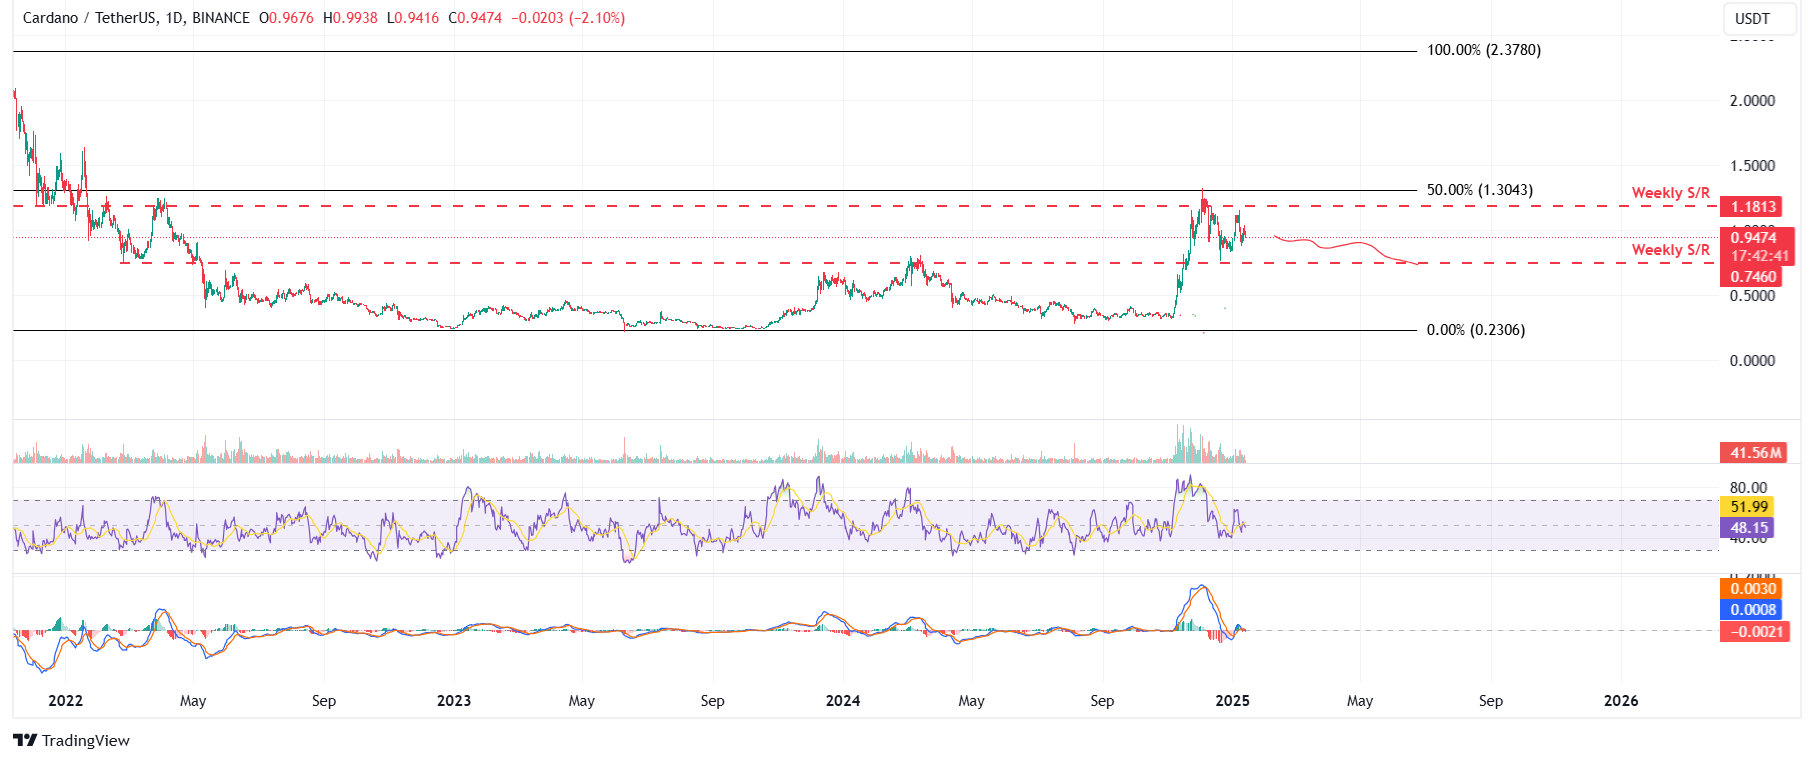
ADA/USDT daily chart
Conversely, if ADA recovers, it could extend the rally to retest its weekly resistance at $1.18.
Author

Manish Chhetri
FXStreet
Manish Chhetri is a crypto specialist with over four years of experience in the cryptocurrency industry.


