Top AI crypto to watch: NEAR, FET, and ICP price predictions support double-digit gains
- The AI crypto segment displays mild gains this week, as DeFi and meme coins lead the market rally.
- AI tokens showcase potential to become top performers in the next capital rotation.
- The technical outlook for these three top AI cryptocurrencies suggests a bull run ahead.

The Artificial Intelligence (AI) tokens in the cryptocurrency market hold sizeable gains as the segment has soared 17% so far in May to reach $38 billion in market capitalization. Decentralized Finance (DeFi) and meme coins have been leading the market rally this week, but a potential segment rotation is likely to boost AI tokens in the coming week, aligning with the price predictions.
AI tokens on the rise
The market capitalization of AI cryptocurrencies has surged to $38.08 billion from $32.46 billion in the last 30 days, recording an inflow of nearly $6 billion. With the rising inflows, the AI tokens are expected to lead the market rally as the crypto market witnesses a sharp rotation of significant capital across different segments. Over the last month, privacy, DeFi, and meme coins have surged significantly, seemingly in chronological order.
With the mild gains this week, AI tokens are hinting at a trend reversal that could make them the next segment leading the market rally. Additionally, upcoming updates from top AI companies, such as OpenAI, Google Gemini, or DeepSeek, could support the price predictions and catalyze a double-digit rally.
NEAR eyes inverse Head and Shoulders pattern breakout
Near protocol (NEAR) is up almost 20% so far in May as it nears the $3 psychological level. The AI token trades at $2.94 at press time on Thursday, forming the right shoulder of an inverse Head and Shoulders pattern, as shown on the daily price chart below.
With a streak of three consecutive bullish candles, the uptrend nears the supply zone at $3, acting as the pattern’s neckline.
The Moving Average Convergence/Divergence (MACD) indicator nears its signal line for a bullish crossover, suggesting a potential trend reversal.
The DeFiLlama data shows a significant growth in Near Protocol’s Total Value Locked (TVL), rising to $173 million from its year-to-date low (April 9) of $124 million. Additionally, the DEXs volume of the protocols holds above $17 million for the third consecutive day. However, a sharp 7% decline in stablecoin market cap to $675 million warns of a liquidity crunch on the network. Overall, the Near Protocol showcases improving DeFi numbers, aligning with the price prediction.
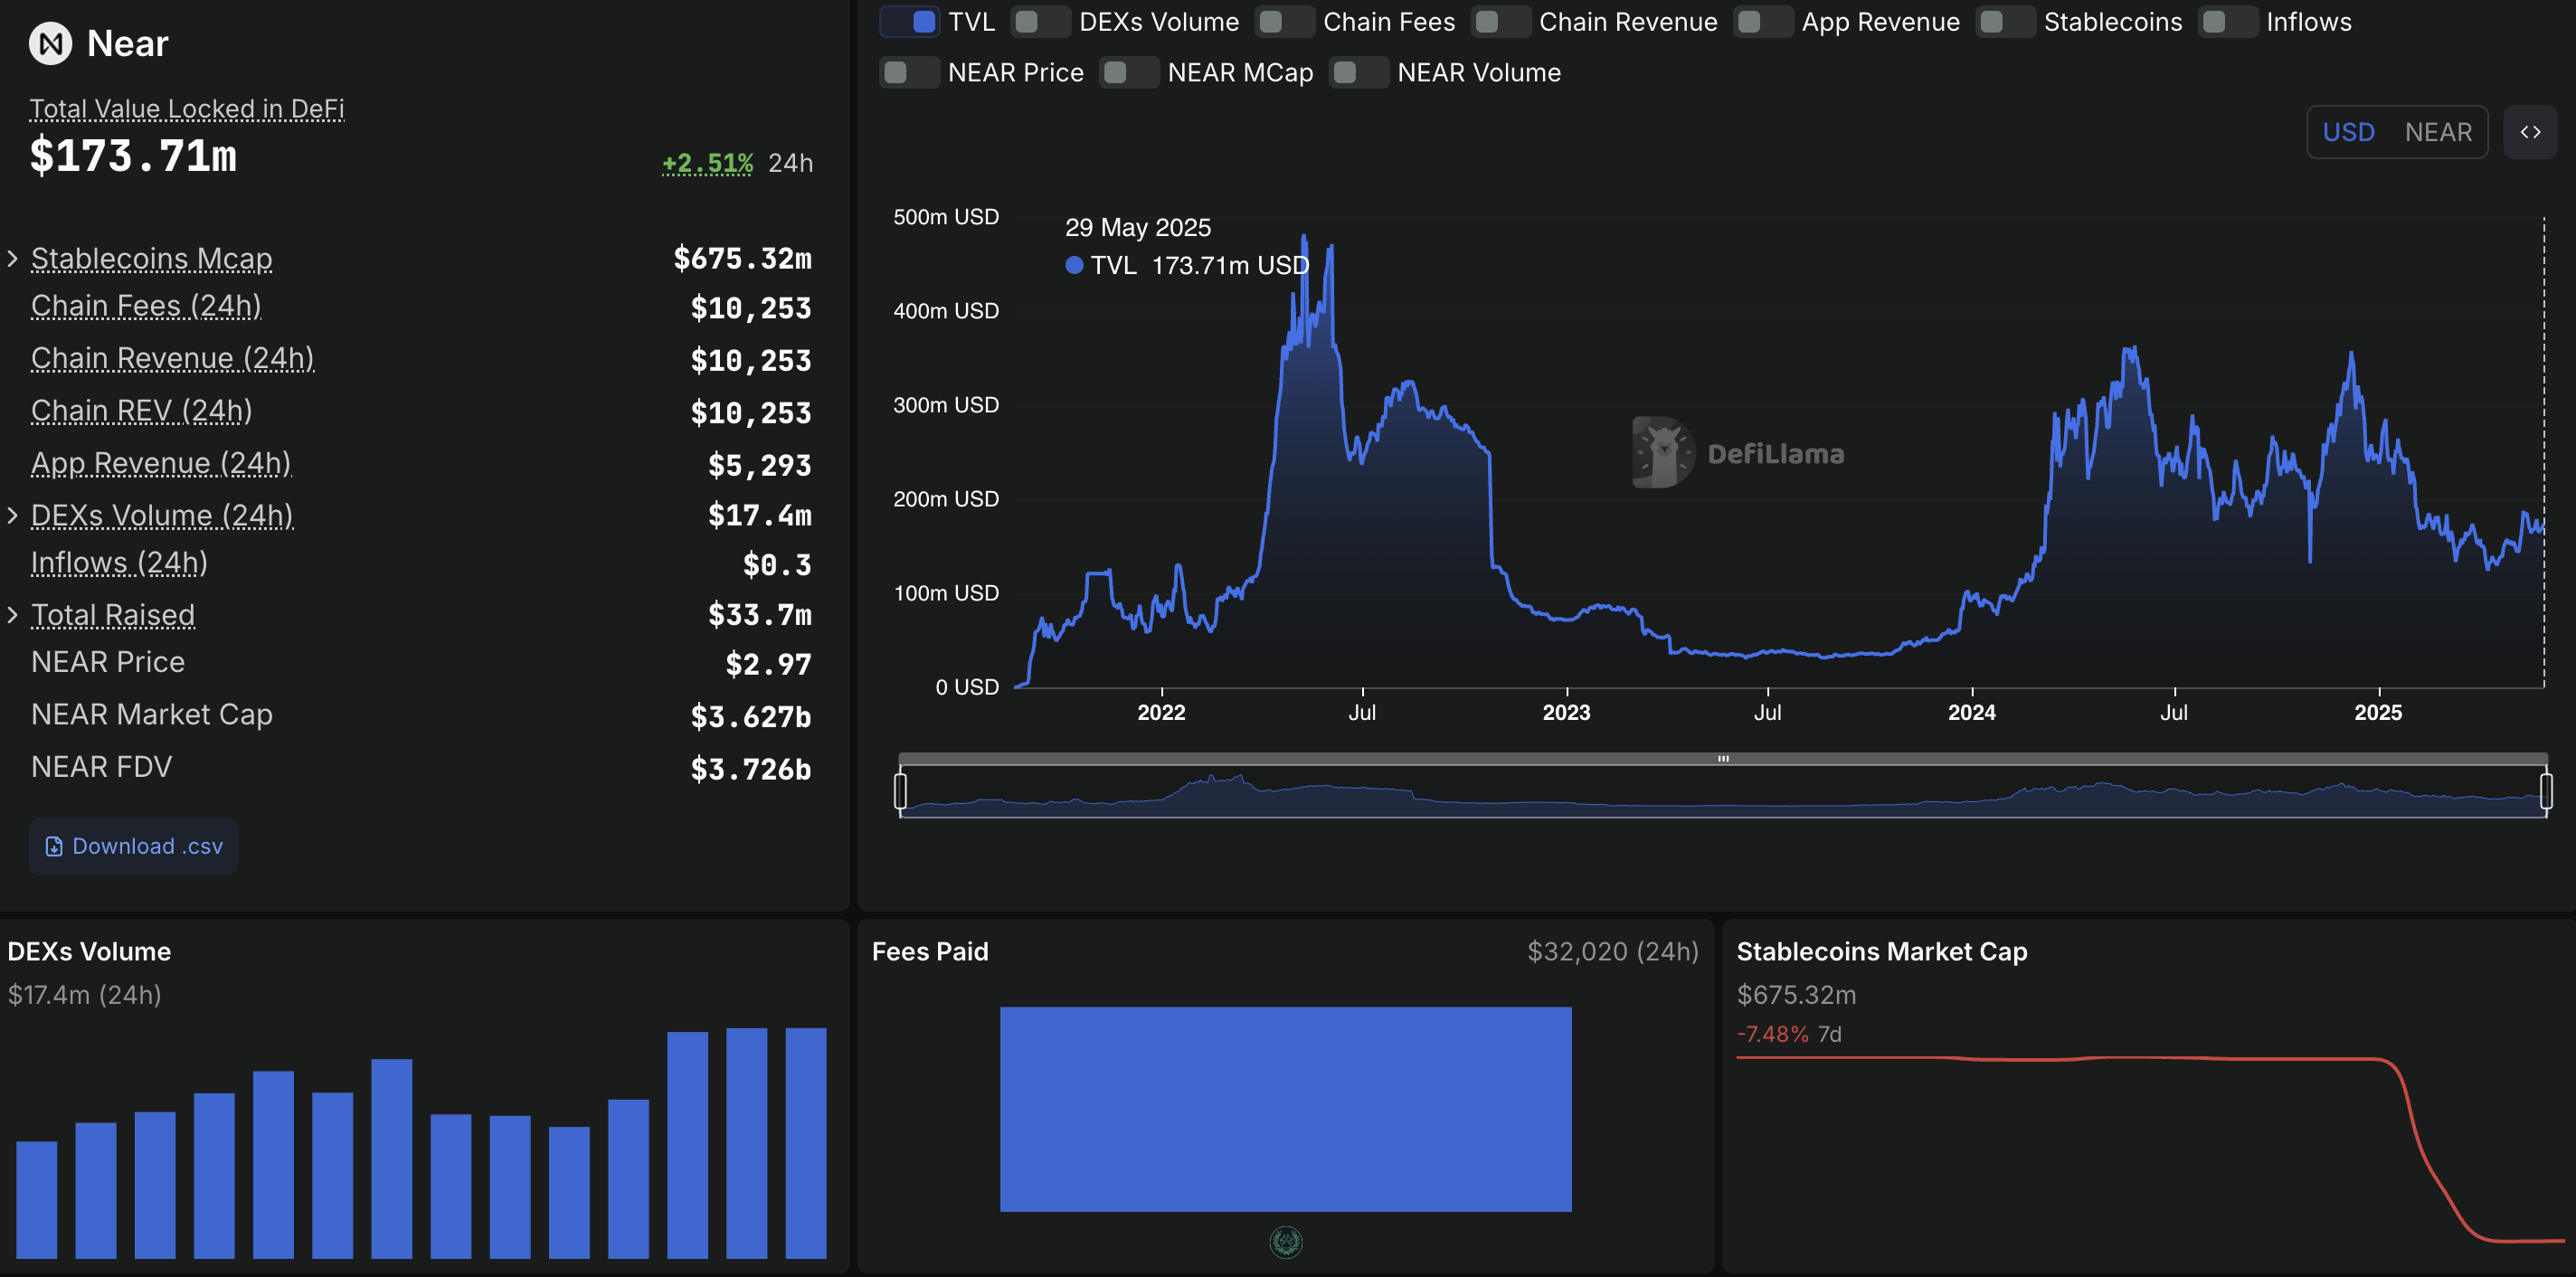
Near Protocol DeFi Data. Source: DeFiLama
A clean push above the $3 neckline could test the next supply zone at $3.50, which led to multiple bullish failures in February. A push above $3.50 projects an upside potential of nearly 20% if the buyers hold ground above the neckline.
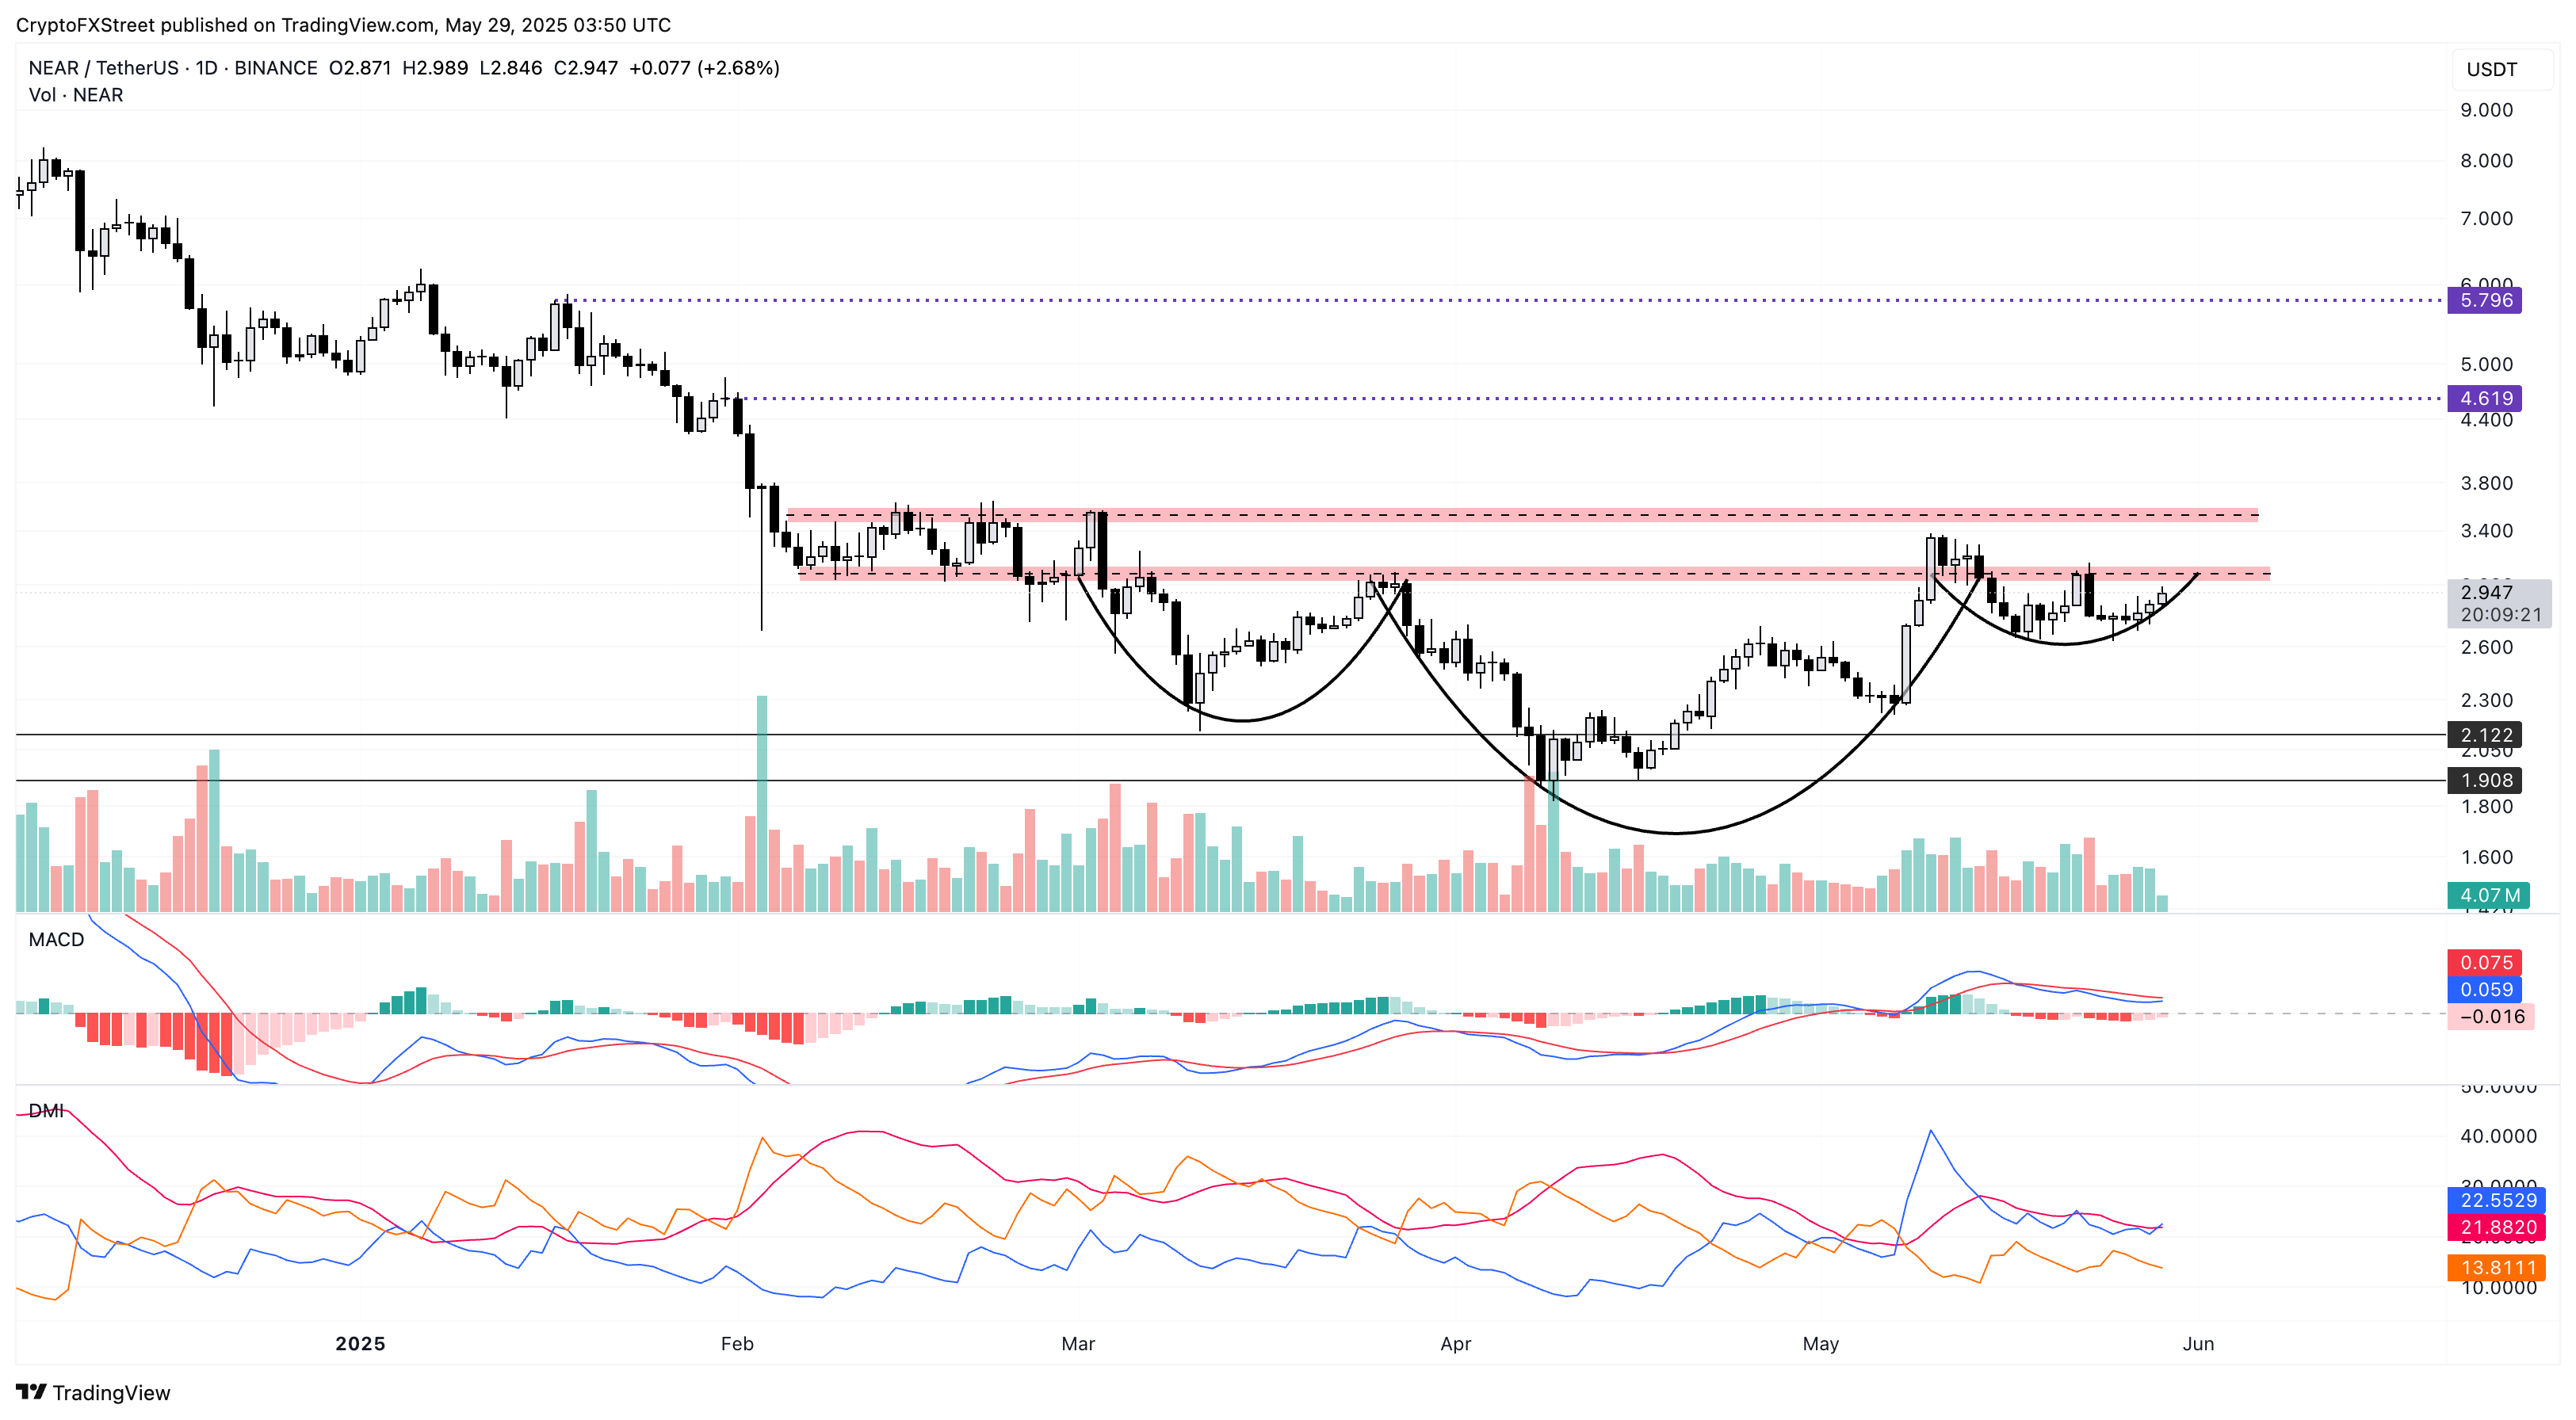
NEAR/USDT daily price chart. Source: Tradingview
On the flip side, a failure to break through the supply zone could cause the NEAR price to decline to the $2.64 support level formed on May 18.
FET aims to reclaim the $1 level
The Artificial SuperIntelligence Alliance (FET) trades at $0.91 on Thursday, posting a 21% surge so far in May, which extends the 62% monthly gains from April. As FET nears the $1 psychological level, the uptrend in motion forms a support trendline with multiple higher lows since last month.
FET exceeds the 200-day Exponential Moving Average (EMA) at $0.89, increasing the bullish crossover chances in the 50-day and 100-day EMAs. The MACD indicator crosses above its signal line to trigger a buy signal, bolstering the chances of an uptrend.
However, the next zone, between $1.04 and $1.22, holds a massive headwind with 710.6 million FET in supply.
Retracing the Fibonacci tool over the 82% crash from $2.13 on December 6 to $0.37 on April 8, the crash’s 50% Fibonacci level is at $1.25, aligning with the upper boundary of the $1.20 supply zone.
In case the bullish trend persists, investors are likely to fuel the uptrend to reach the 50% Fibonacci retracement at $1.25, projecting an upside of 25% upon a breakout above $1.
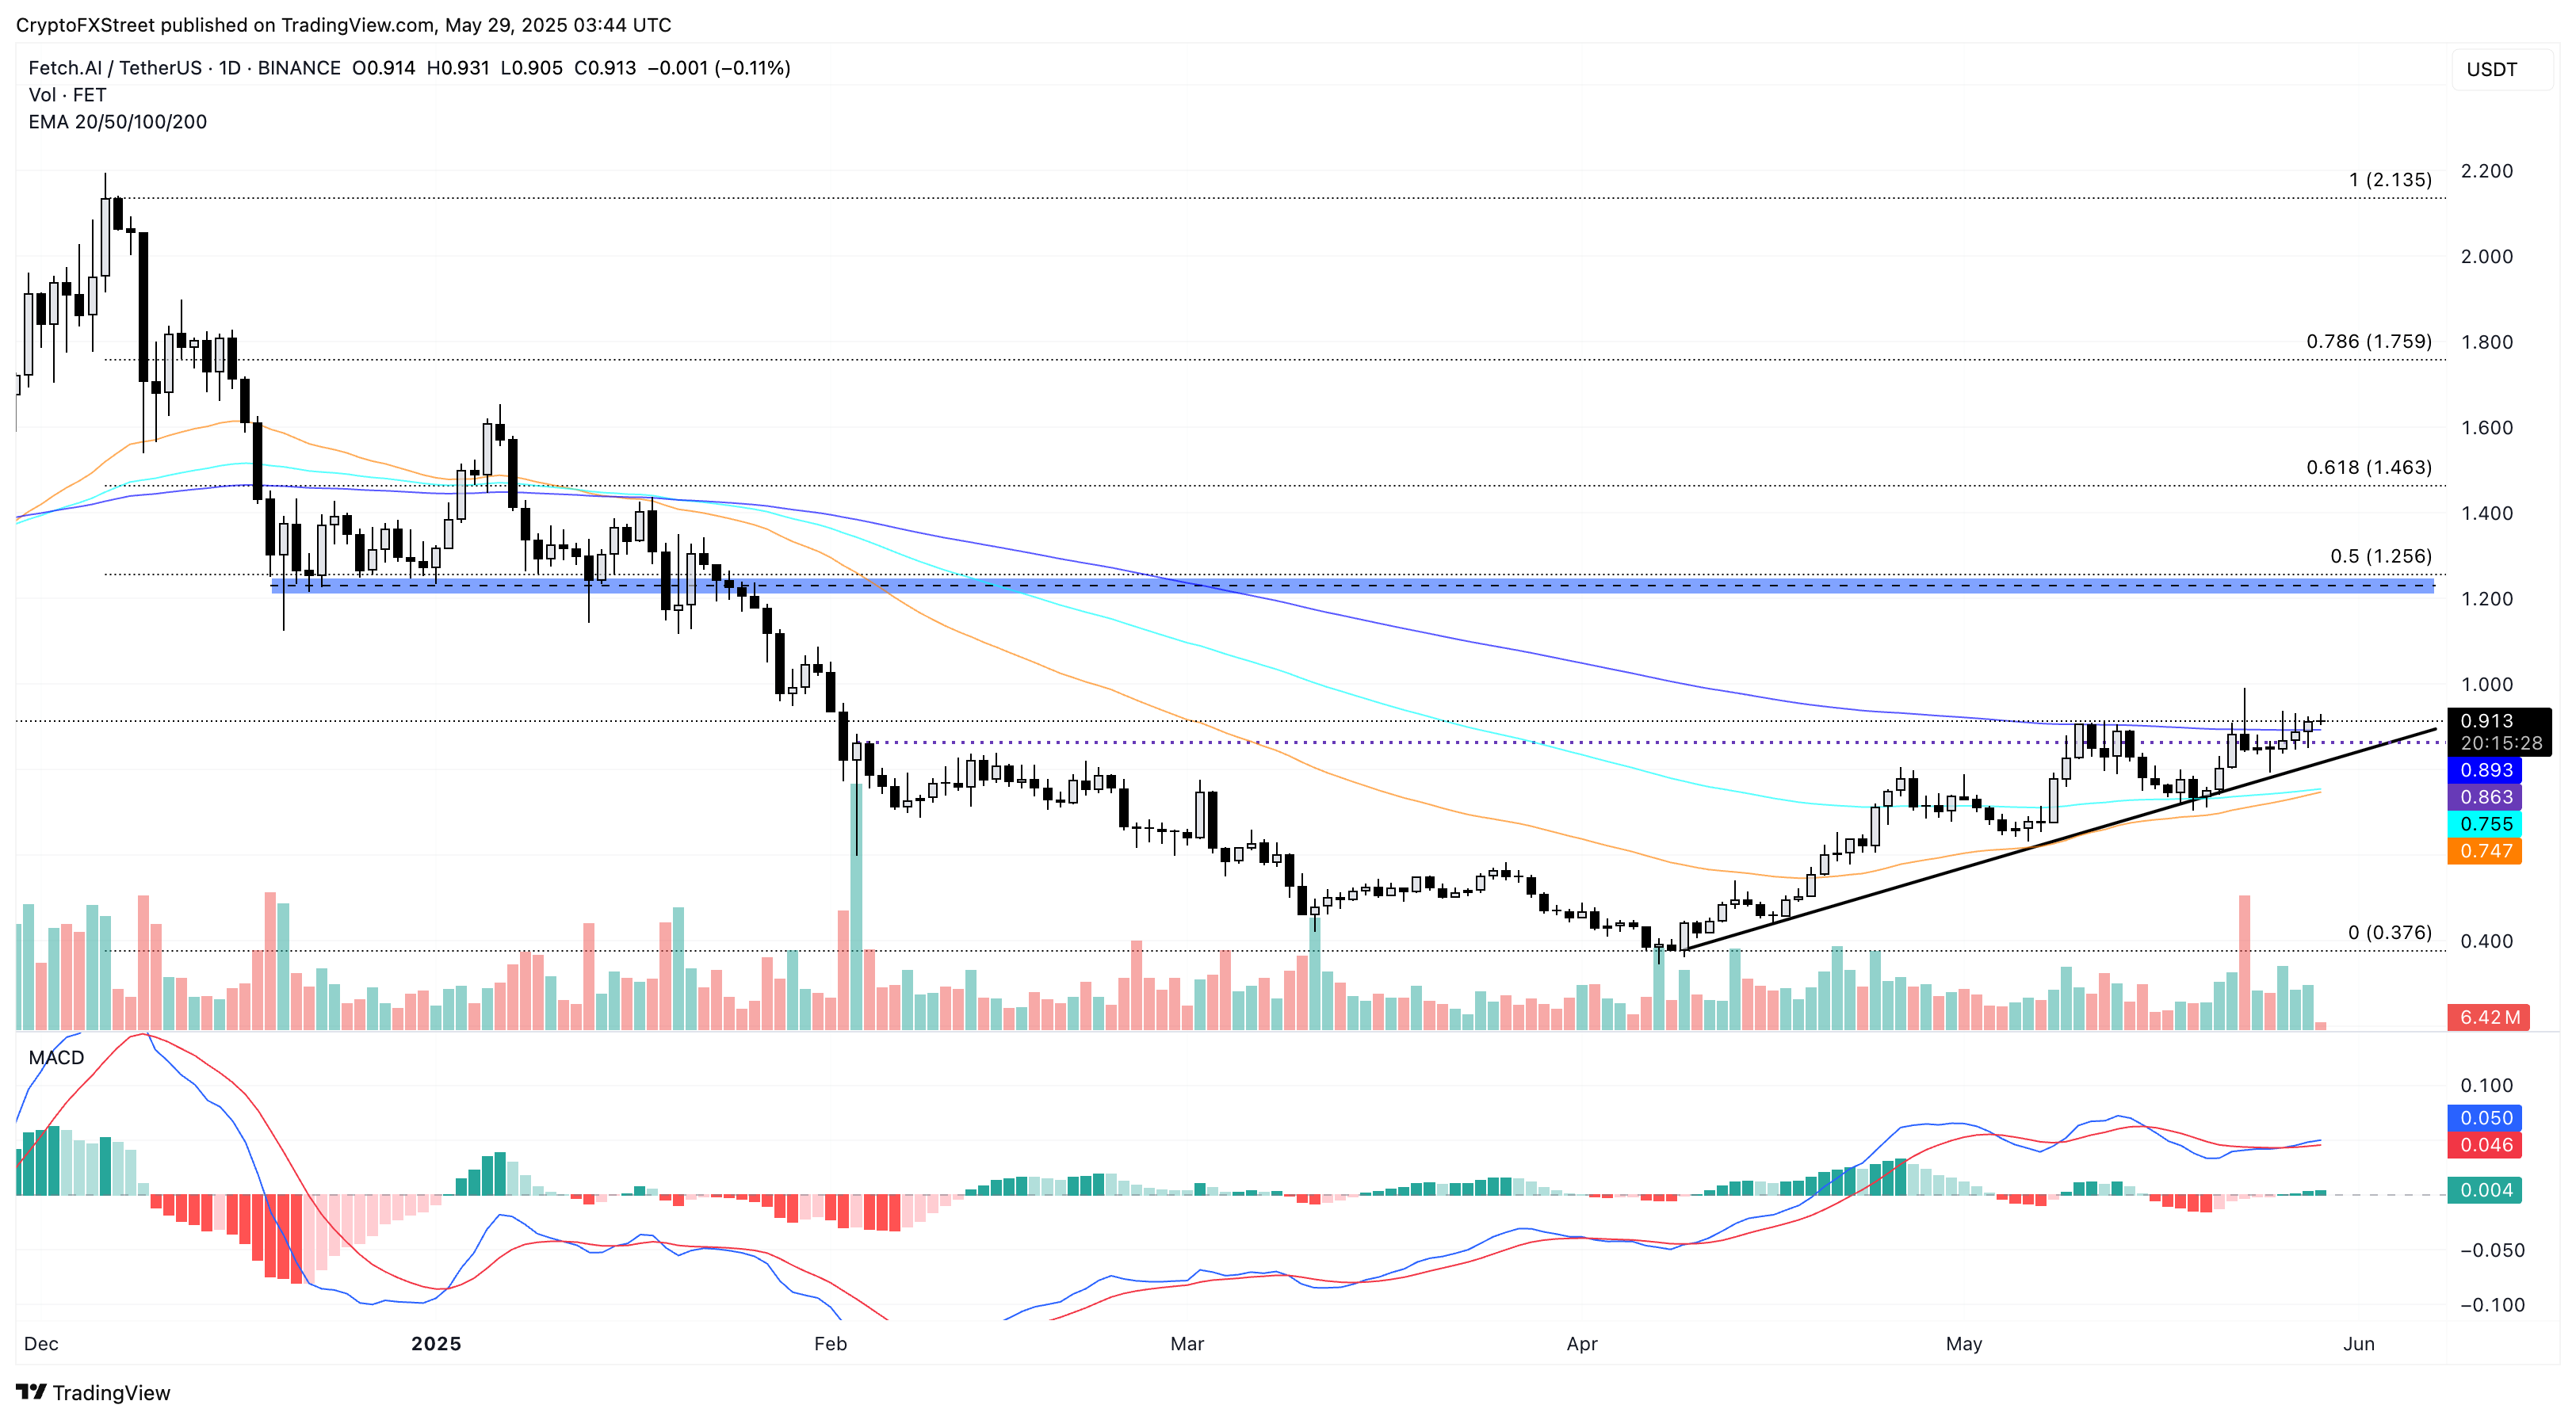
FET/USDT daily price chart. Source: Tradingview
As per IntoTheBlock’s Global In/Out of the Money (GIOM) indicator, the immediate resistance zone lies between $0.93 and $1.02, where 2.02K investors acquired 35.02 million FET tokens at an average price of $0.97.
Compared to the current “At the Money” zone between $0.84 and $0.93 with 107.42 million FET tokens held by 5.72K investors, the immediate resistance lacks in supply. This increases the chances of uptrend continuation above $1.
However, the next zone, between $1.04 and $1.22, holds a massive headwind with 710.6 million FET in supply.
This increases the chances of an uptrend continuation above $1.
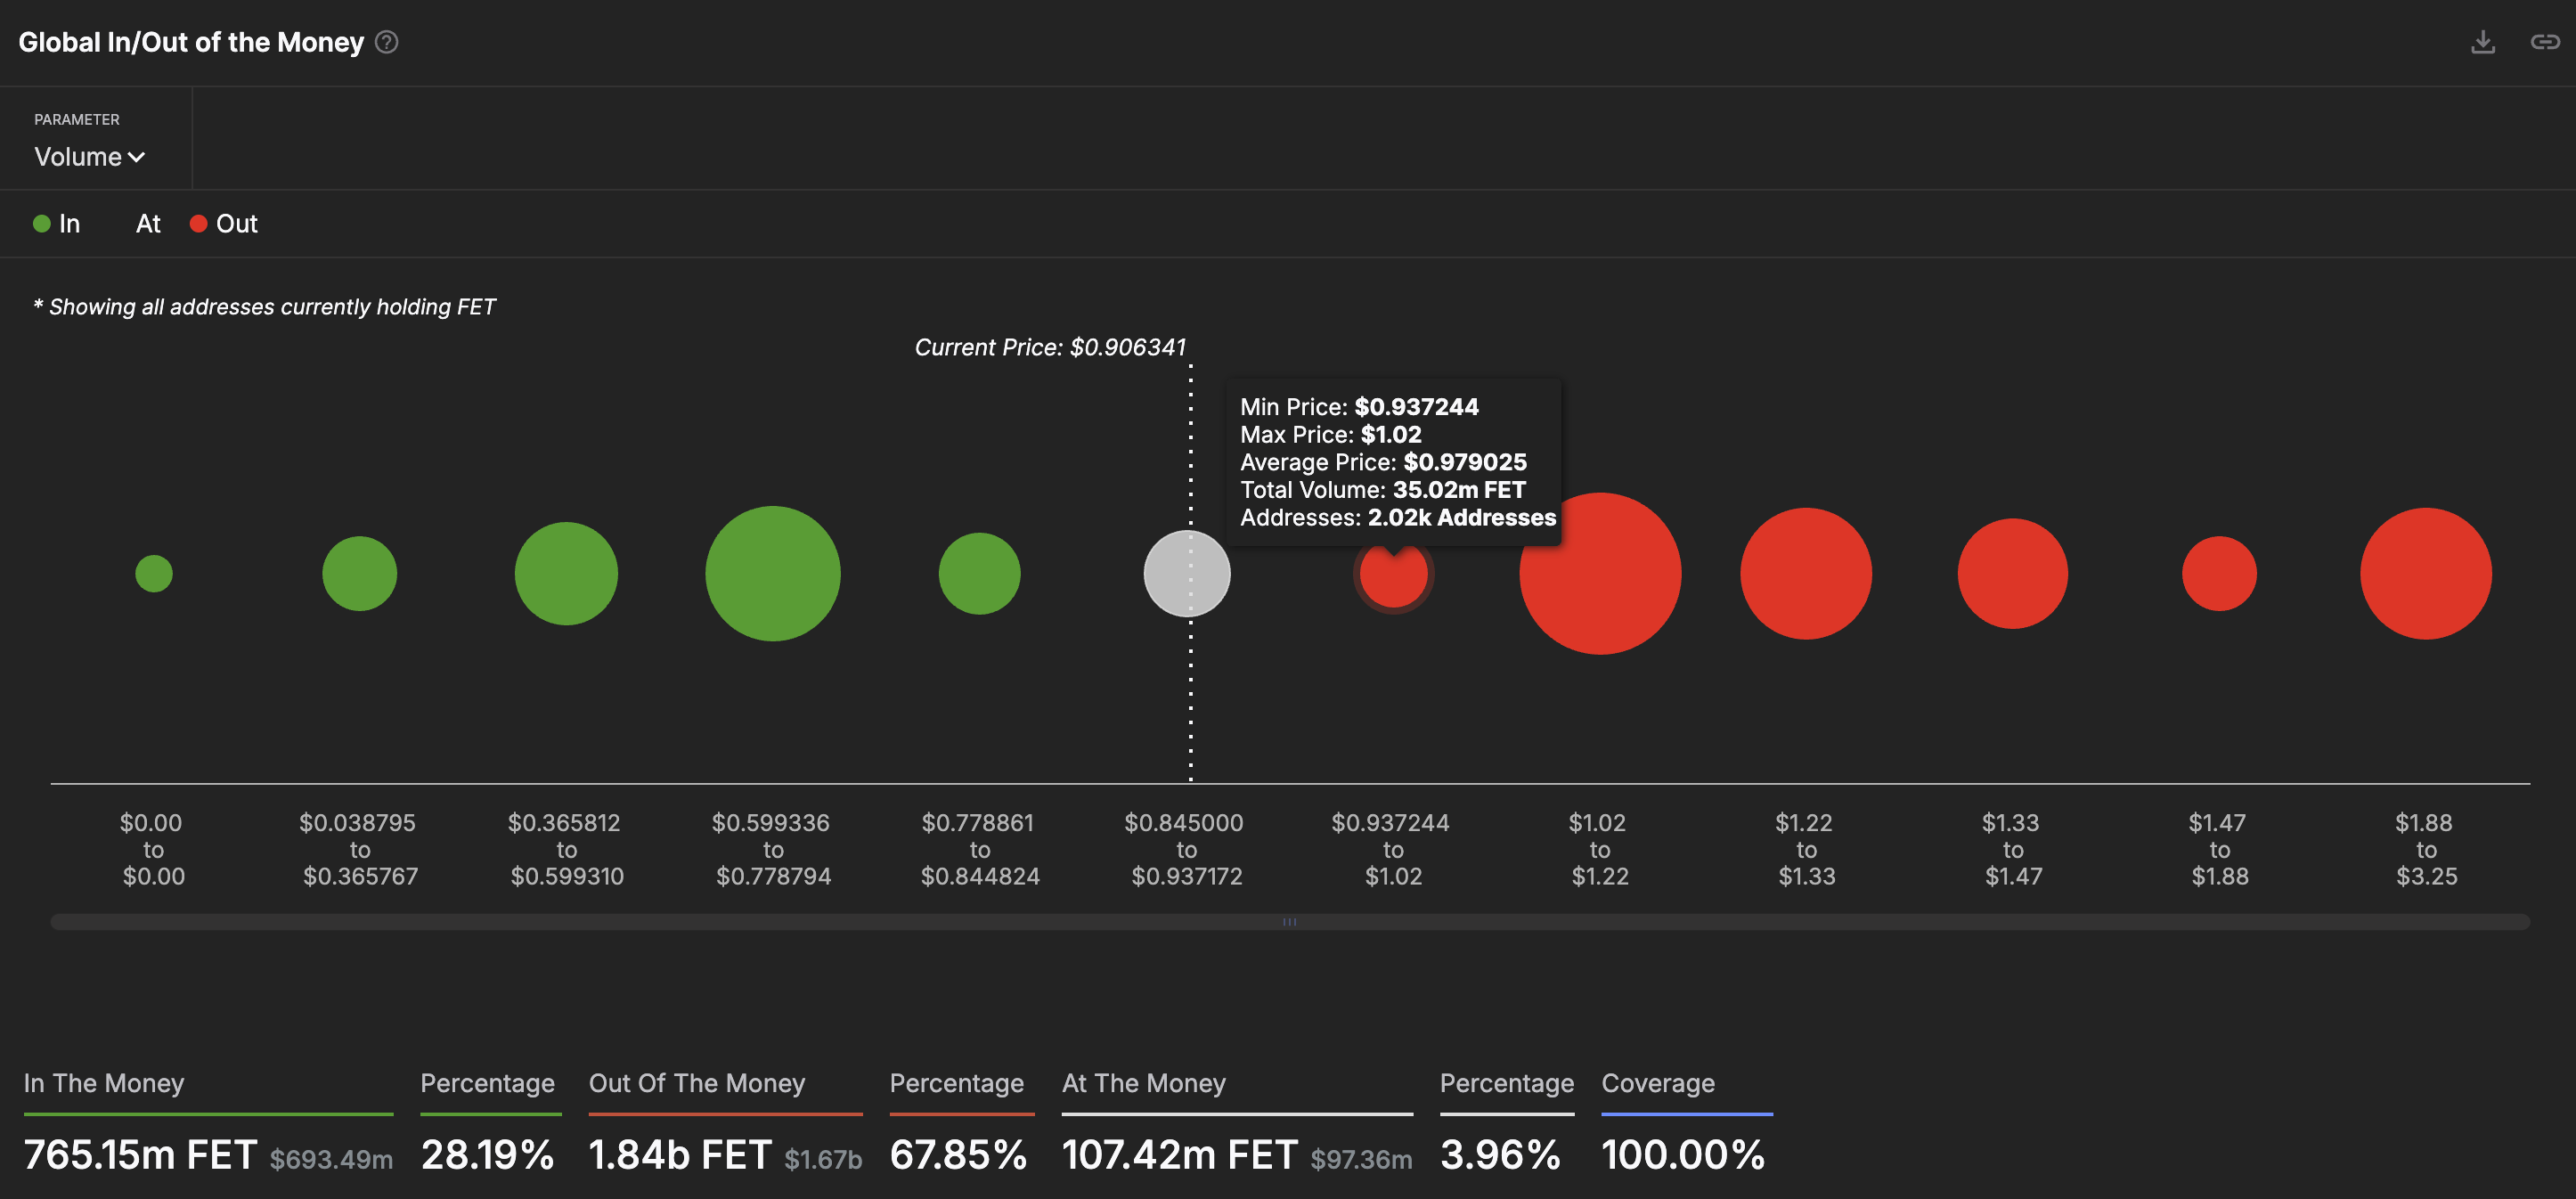
Global In/Out of the Money. Source: IntoTheBlock
A bullish failure to surpass $1 could retest the immediate support trendline at $0.82.
ICP eyes continuation to $6
The Internet Computer (ICP) is close to concluding its fifth consecutive bearish monthly close, having recorded a 10% rise so far in May. As ICP prepares for a trend reversal, the daily price action and technical indicators suggest a possible bullish bias.
The AI crypto token trades at $5.51 with over 1% in intraday gains, nearing the 7-day high of $5.84
The momentum indicators support the breakout chances: The MACD and its signal line are close, triggering a bullish crossover with the RSI line at 55, which maintains an uptrend, signaling a surge in bullish momentum.
The immediate resistance lies at $6.08, aligning with the 23.6% Fibonacci level retraced over the 70% crash from $15.22 to $4.58 between December 7 and April 8.
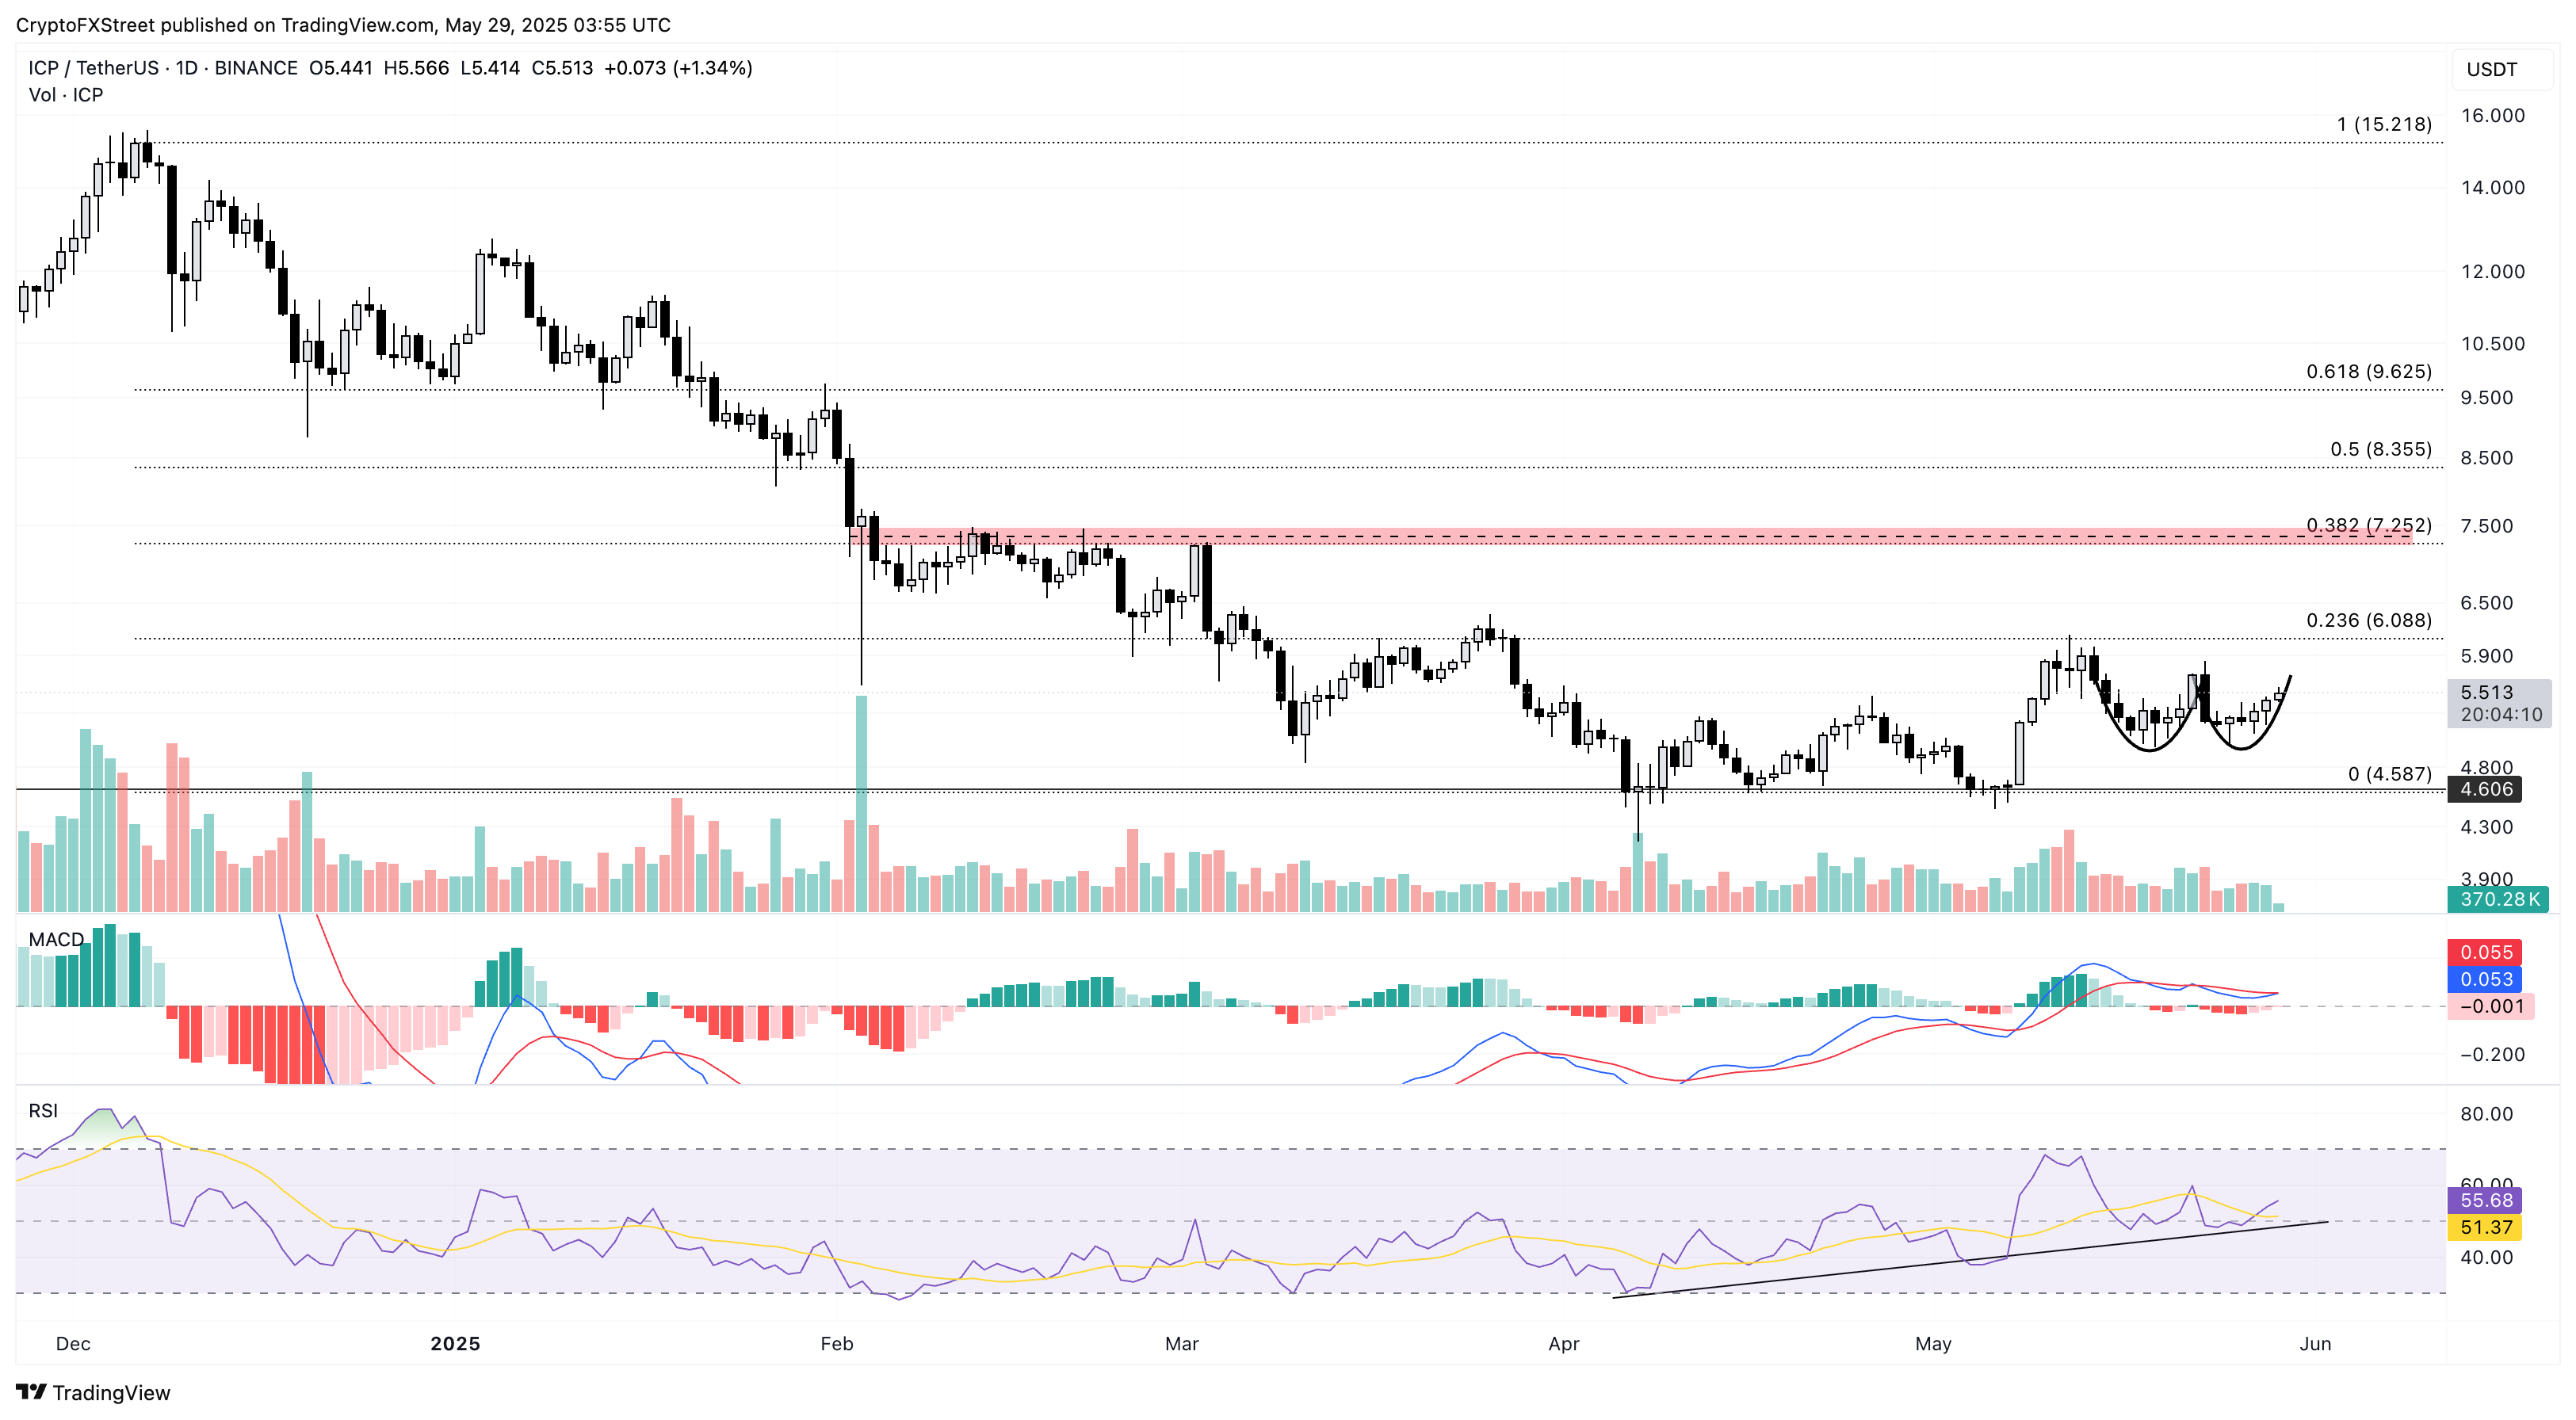
ICP/USDT daily price chart. Source: Tradingview
Conversely, a reversal from the $5.84 resistance will invalidate the bullish pattern, extending a drop to $5.01, the weekly low.
Author

Vishal Dixit
FXStreet
Vishal Dixit holds a B.Sc. in Chemistry from Wilson College but found his true calling in the world of crypto.



