Solana DeFi TVL, futures open interest remain elevated as SOL price consolidates
- Solana moves sideways within key support and resistance levels at $164 and $185, respectively.
- Solana’s DeFi TVL has increased by 28% since April 1 to $9.34 billion, signaling confidence in the protocol.
- SOL futures Open Interest rises to $7.35 billion, upholding risk-on sentiment and heightened market participation.
- Solana’s technical outlook presents mixed signals, with the MACD and RSI indicators trending downward.

Solana’s (SOL) price is extending its consolidation between key support and resistance levels, currently hovering around $174 at the time of writing on Wednesday. Its higher lows pattern since the April 7 tariff-triggered crash to $95.55 has been supported by strong sentiment in the broader cryptocurrency market. The bullish outlook mirrors a persistent growth in SOL’s Decentralized Finance (DeFi) Total Value Locked (TVL) and elevated futures contracts Open Interest (OI).
Solana DeFi TVL steadies above $9 billion
Solana plays an important role in DeFi, supported by the blockchain’s low fees and high transaction throughput. The platform also allows holders to lock their coins in various smart contracts, contributing to the security of the Proof-of-Stake (PoS) network while earning rewards.
According to DefiLlama, the total value of all coins held in smart contracts across all protocols on the chain stands at $9.34 billion, up from $6.63 billion on April 1. This represents an approximately 28% increase in locked value.
Investors aggressively lock coins in smart contracts when they intend to hold them for an extended period, thereby reducing the supply on exchanges and, subsequently, the potential selling pressure. The increase in DeFi TVL is a bullish signal.
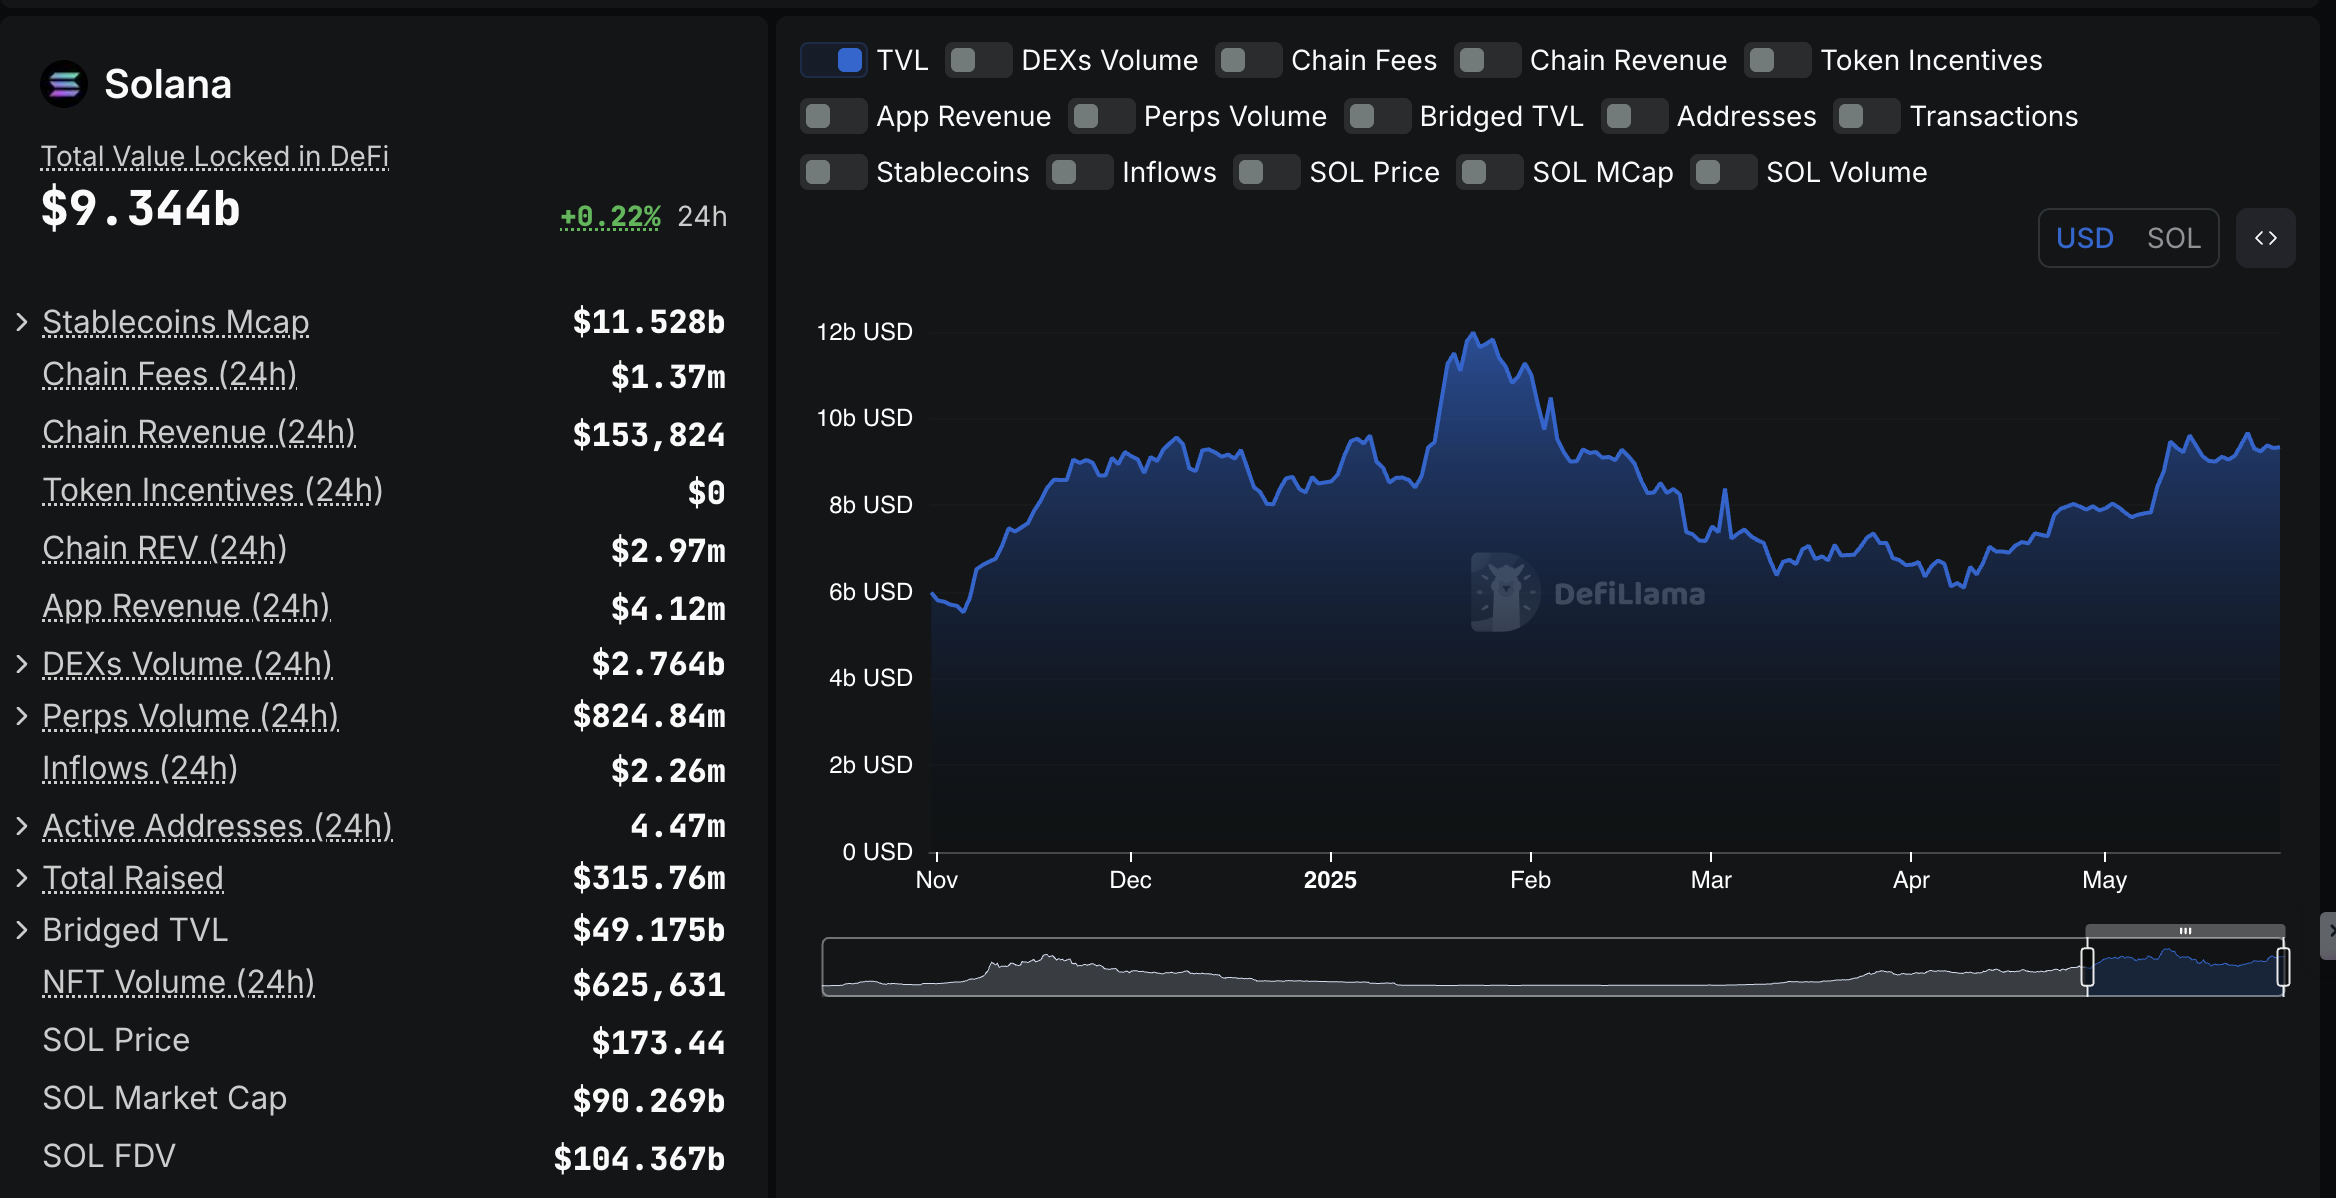
Solana DeFi TVL stats | Source: DefiLlama
Solana’s performance in the microenvironment, particularly in the derivatives market, signals steady interest and rising bets on the price, reaching higher levels. CoinGlass data shows that SOL futures OI is currently consolidating at around $7.35 billion after increasing from $6.4 billion recorded on May 20.
OI refers to the outstanding number of contracts, such as futures or options, that remain unsettled or unclosed. The increase in OI, alongside the trading volume of $9.4 billion, highlights heightened market activity and bullish conviction. In other words, traders are opening new positions in anticipation of further price gains.
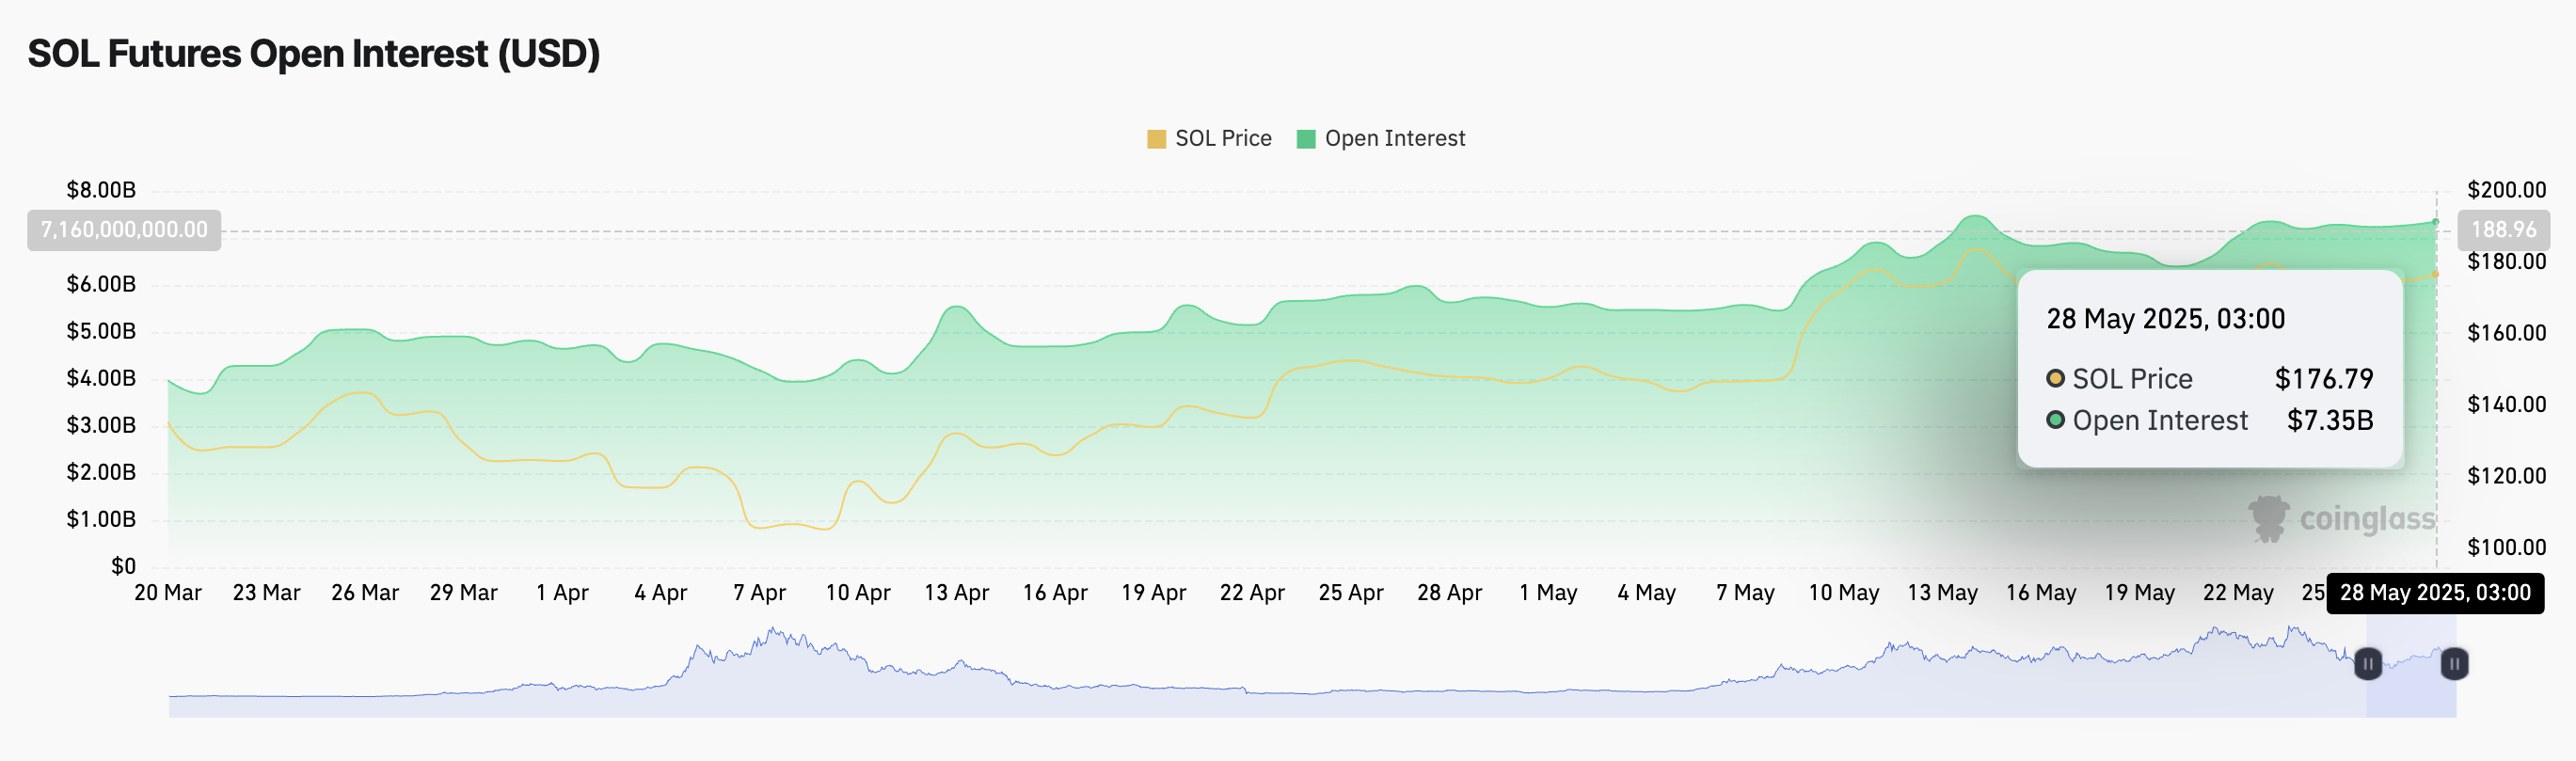
Solana futures contracts Open Interest | Source: CoinGlass
Technical Outlook: Can Solana bulls defend key support level?
Solana’s price trades within two key levels: the 200-day Exponential Moving Average (EMA), which offers support at approximately $164 and $185, where the uptrend recently faltered.
A sell signal from the Moving Average Convergence Divergence (MACD) indicator was confirmed on May 18, when the blue MACD line crossed below the red signal line. The downtrend targeting the mean line (0.00) and the red histogram bars expanding below it suggest an intensifying bearish momentum.
The Relative Strength Index (RSI) downtrend approaching the 50 midline reflects Solana’s fading bullish momentum. Should the RSI slide below this pivotal level, the path with the least resistance could stay downwards, leaving SOL vulnerable to sell-side pressure.
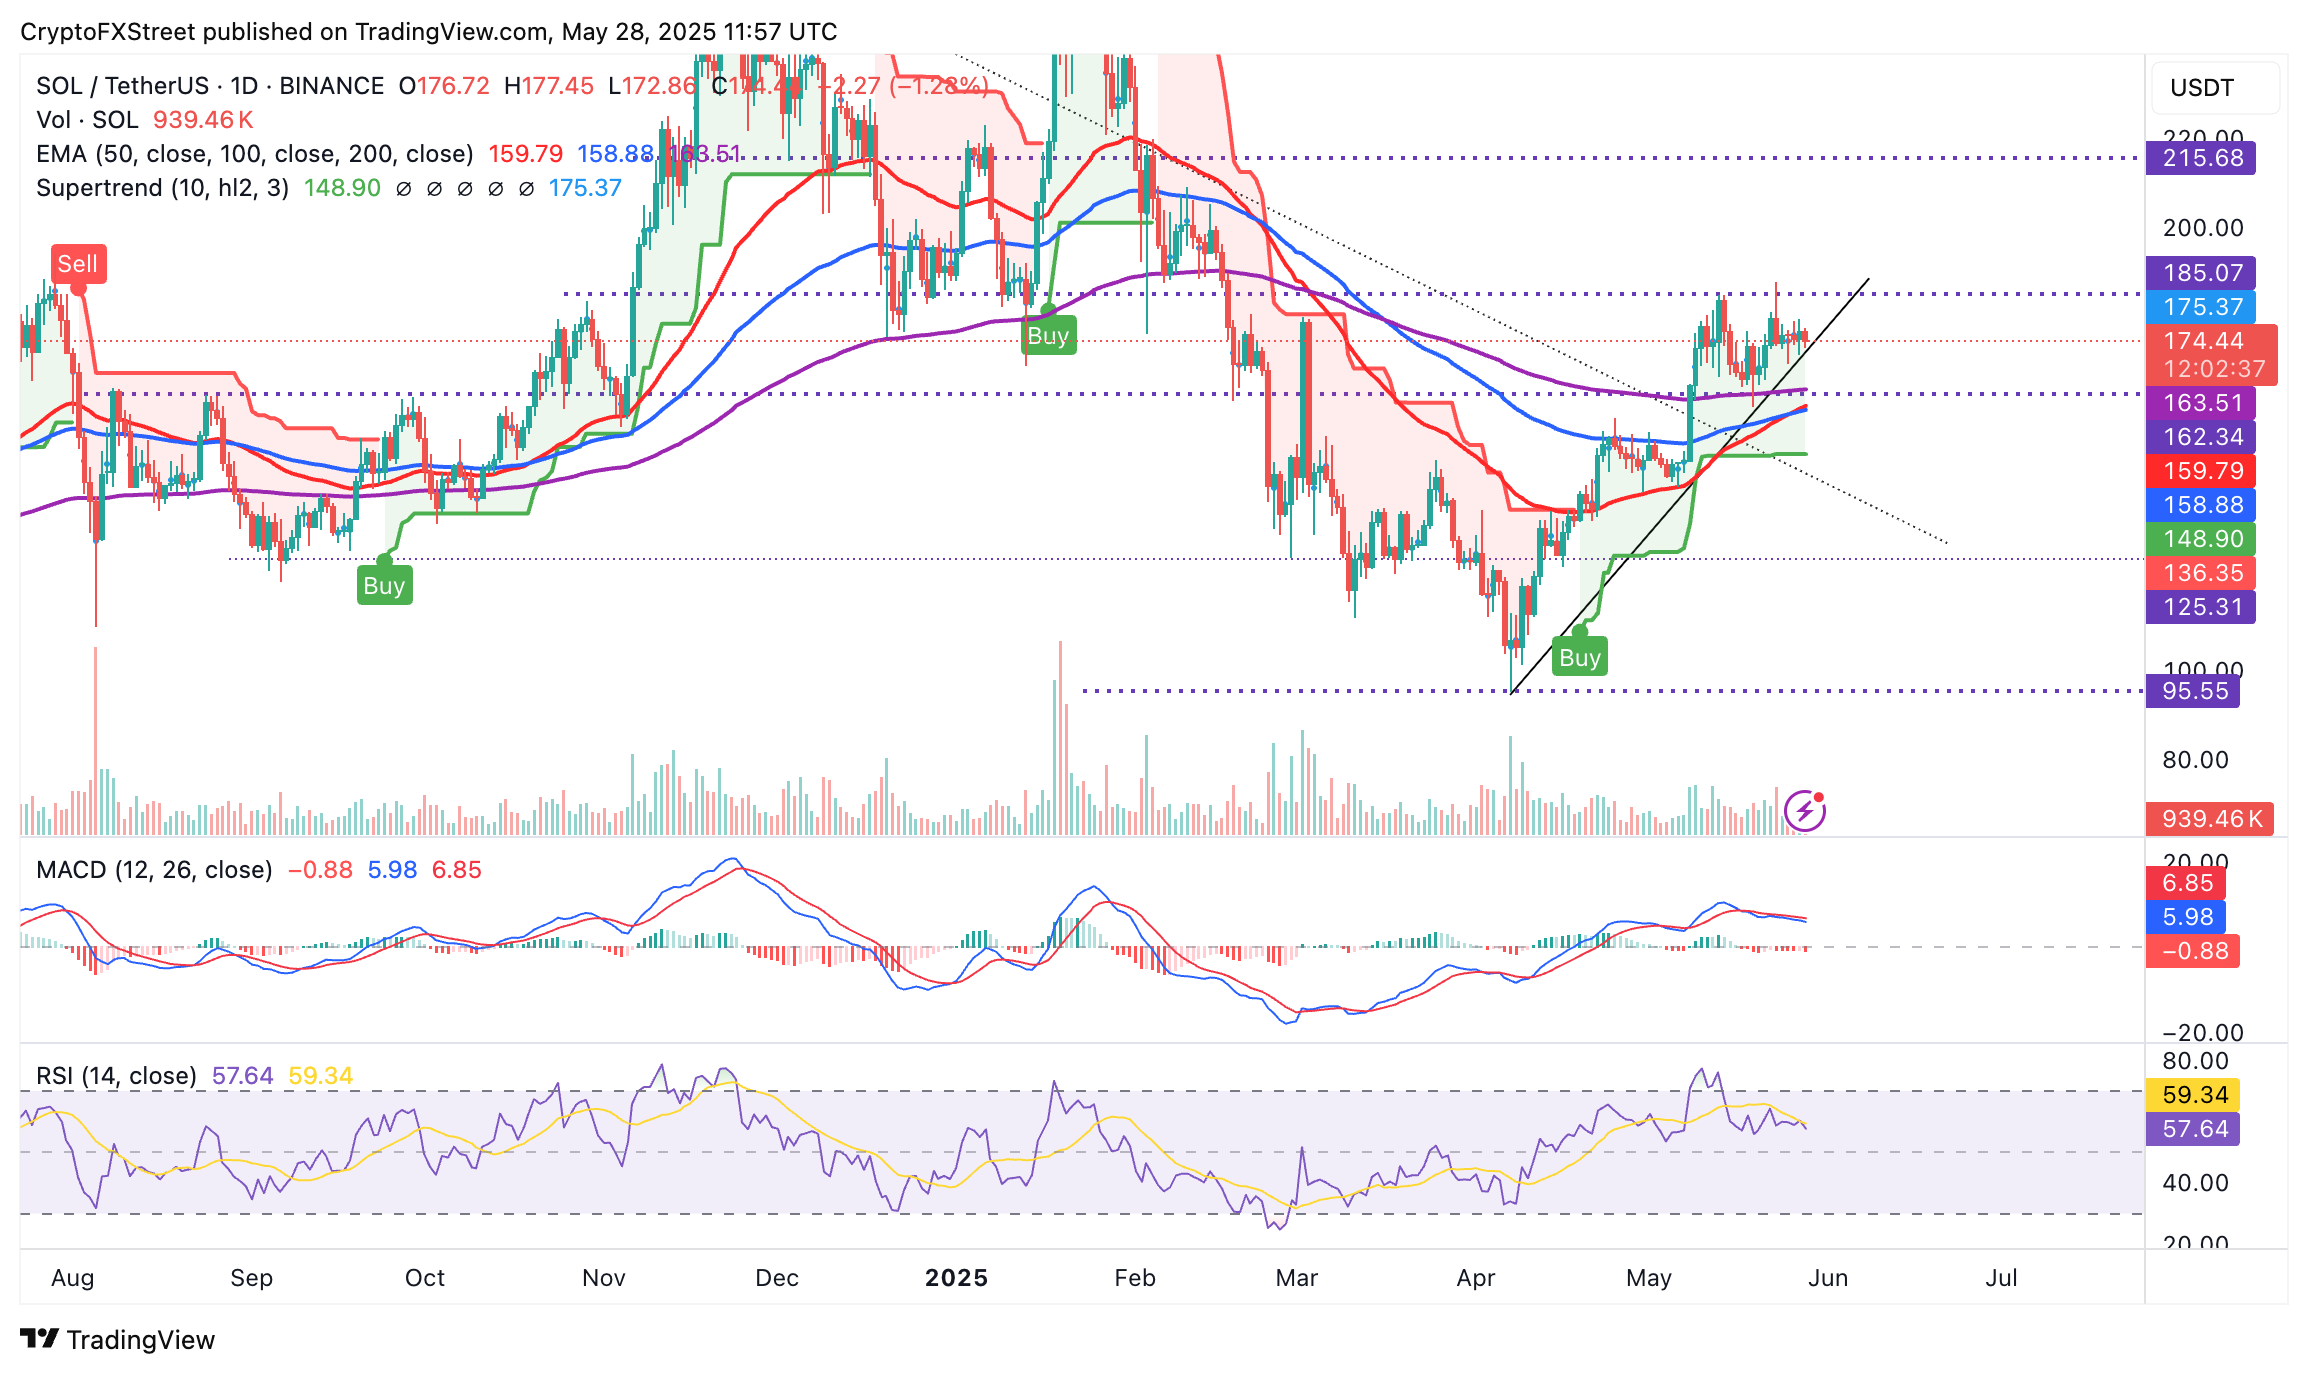
SOL/USD daily chart
Traders would monitor SOL’s reaction to the ascending trendline, with a break below it likely to pave the way to extended losses. Key areas of interest include the 200-day EMA support at around $164, the confluence support at around $159, combining the 50-day and the 100-day EMAs, as well as the demand zone at $140, which was tested during the first week of May.
A buy signal from the SuperTrend indicator could boost SOL’s bullish structure, especially for traders using it as a dynamic support. This trend-following tool sends a buy signal when the price crosses above the SuperTrend line, with the color changing from red to green. Notably, breaking above the upper consolidation range at $185 would bring higher levels into focus, including the area at $200, tested as resistance in early April.
Open Interest, funding rate FAQs
Higher Open Interest is associated with higher liquidity and new capital inflow to the market. This is considered the equivalent of increase in efficiency and the ongoing trend continues. When Open Interest decreases, it is considered a sign of liquidation in the market, investors are leaving and the overall demand for an asset is on a decline, fueling a bearish sentiment among investors.
Funding fees bridge the difference between spot prices and prices of futures contracts of an asset by increasing liquidation risks faced by traders. A consistently high and positive funding rate implies there is a bullish sentiment among market participants and there is an expectation of a price hike. A consistently negative funding rate for an asset implies a bearish sentiment, indicating that traders expect the cryptocurrency’s price to fall and a bearish trend reversal is likely to occur.
Author

John Isige
FXStreet
John Isige is a seasoned cryptocurrency journalist and markets analyst committed to delivering high-quality, actionable insights tailored to traders, investors, and crypto enthusiasts. He enjoys deep dives into emerging Web3 tren



