Top 3 Price Predictions Bitcoin, Ethereum, Ripple: Technical ladders to get out of this hole - Confluence Detector
- Cryptocurrencies suffered another leg down amid "socialized clawbacks" and other issues
-
To get out of the low levels, coins first need to overcome levels found by the confluence detector.
-
Bitcoin may find it hard, Ethereum is well-supported, and Ripple is in trouble.

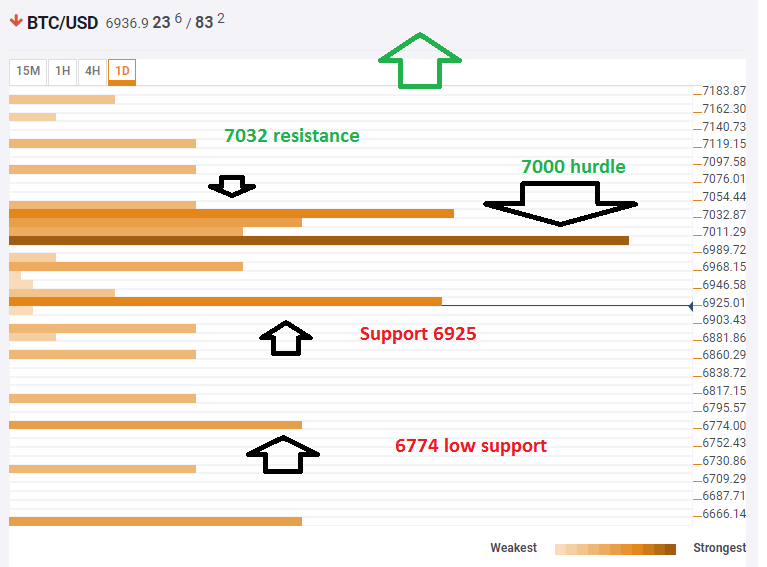
BTC/USD 1D
Bitcoin has no mysteries in the level that it needs to climb over. It is the round number of $7,000. Apart from being round, the figure is also the convergence of the Fibonacci 61.8% one-month, the Bolinger Band 15-Upper (Standard Deviation 2.2), the Simple Moving Average (SMA) 10-one hour and the Fibonacci 48.2% one-day.
The next notable line is close, at $7,032 which is the SMA 5-4h, the Pivot Point one-week Support 1, and the BB 1h-Middle. Further up, it can run quite smoothly to $7,2000.
Support is at $6,925 which is the PP one-day S1, the BB 1h-Lower, the SMA 50-1d, and the SMA 5-15m. Below, $6,774 is low support at the confluence of the Fibonacci 161.8% one-day and the BB 4h-Lower.
Click to see the Full Confluence Indicator
Get 24/7 Crypto updates in our social media channels: Give us a follow at @FXSCrypto and our FXStreet Crypto Trading Telegram channel
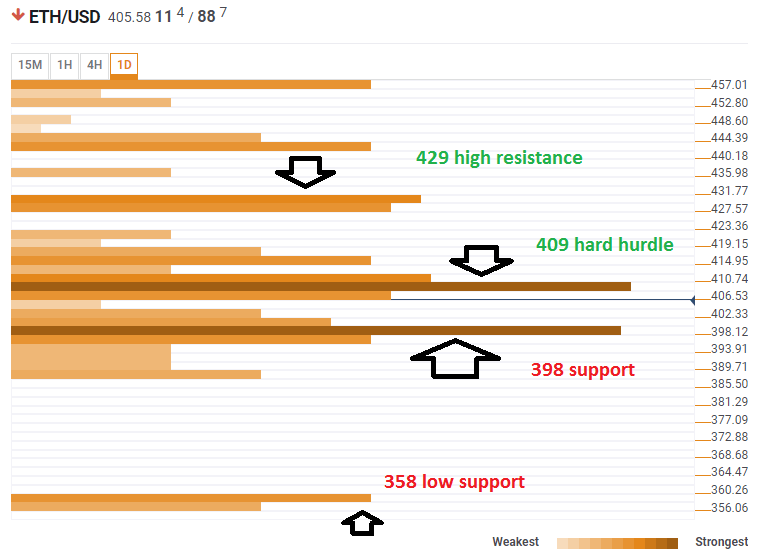
ETH/USD 1D
The price of Ethereum is sandwiched between two critical congestion areas. The good news is that another collapse does not look imminent. However, recovering is complicated as well.
To rise, it needs to overcome $409 which is a dense cluster of levels including the SMA 50-1h, the SMA 200-15m, the SMA 10-4h, the SMA 10-1h, the BB 15m-Upper, the Fibonacci 38.2% one-day, the SMA 100-15m, the SMA 50-15m, and the SMA 5-4h.
On the other side, $398 is the convergence of last week's low, last month's low, the PP one-month S1, the BB one-day Lower, and the PP one-day S1.
Lower, significant support is found only at $358 which is the meeting point of the PP one-month S2 and the PP one-week S2.
To the upside, resistance is at $429 which is the confluence of the PP one-day R3, the SMA 200-1h, the Fibonacci 38.2%, and the SMA 50-4h.
Click to see the Full Confluence Indicator
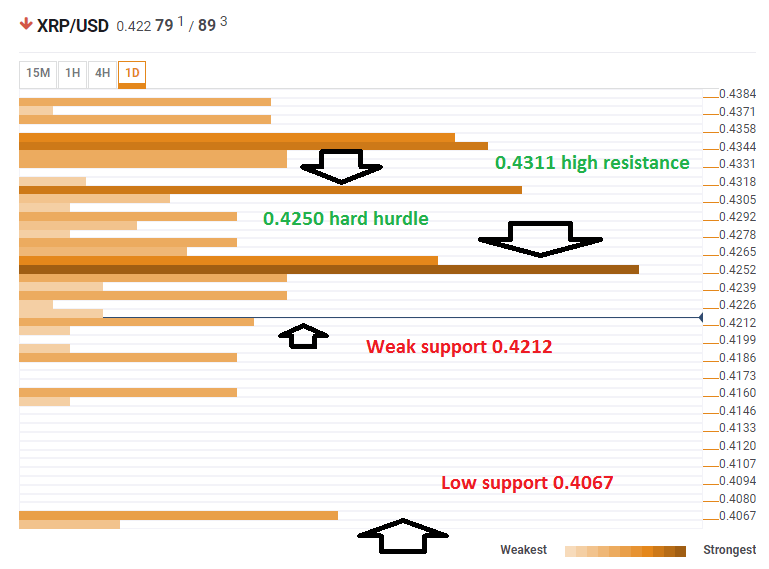
XRP/USD 1D
Ripple is in a mire. It is easy to see why it cannot rise but it is too easy to see it collapse.
A hard cap awaits at $0.4250 which is the confluence of last month's low, the BB 4h-Lower, the 4h low, the BB 15m-Middle, the 1h-high, and the SMA 5-1h.
Overcoming that level opens the door to limited gains towards $0.4311 where we see the congestion of the SMA 200-15m, the SMA 50-1h, the Fibonacci 61.8% one-day, the BB one-hour Middle, the SMA 5-4h, and the SMA 100-15m. And it does not get better above that line.
The XRP/USD has some support at $0.4212 where we see the meeting point of the Fibonacci 161.8% one-day and the BB 15m-Lower.
Further down, support clusters are few and far between. Substantial support is only at $0.4067 which is the Pivot Point one-week Support.
All in all, there is more support than resistance. The path of least resistance is down for Ripple.
Click to see the Full Confluence Indicator
Author

Yohay Elam
FXStreet
Yohay is in Forex since 2008 when he founded Forex Crunch, a blog crafted in his free time that turned into a fully-fledged currency website later sold to Finixio.


