Top 3 Price Predictions Bitcoin, Ethereum, Ripple: Bears got tired, but bull are still skeptical - Confluence Detector
- BTC/USD recovers from recent lows stuck at $7,600.
- ETH/USD consolidates at $420 level.
- XRP/USD bulls were discouraged by $0.4600 resistance.

Bitcoin bears seem to have slowed down a little following 11% drop from recent high registered at $8,500. The crypto market has entered a consolidation phase, though XRP demonstrated particularly strong growth with no clear fundamental reasons readily available.
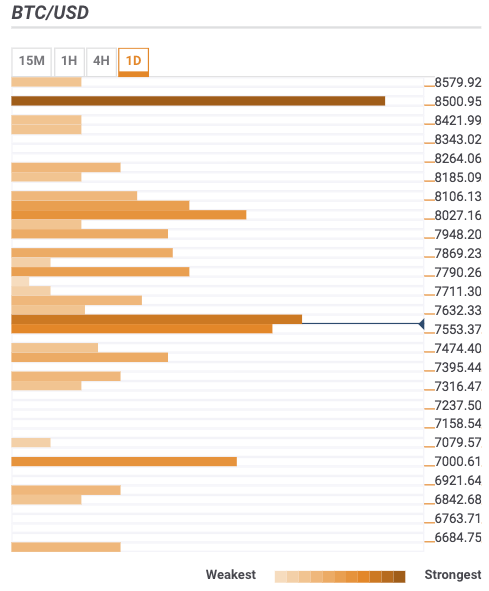
BTC/USD 1D
BTCUSD virtually bumped into a strong confluence zone at the price level of $7,630. The indicators that create this critical confluence and listed from lowest to the highest price level, among others:
Fibonacci 38.2% one-month, SMA 50-15m, 15 min low, 1-hour low, the SMA 10-1-hour, the Bolinger Band 15m-Middle, the SMA 5-1h, and the SMA 100-daily.
Once this area is cleared, the upside may be extended towards psychological $8,000, reinforced by SMA100 (1-hour chart) and SMA10 (daily). This level is followed by the ultimate resistance of $8,500, which encompasses both last month and last week highs as well as 161.8% Fibo retracement level (daily). Considering the importance of the confluence area, it will be hard to break it at the first attempt.
Below the current price of $7,605, the first support is created by BB 1h-Lower and the BB one-day Middle. It is followed by the last week low at $7,378 and the most potent confluence created by psychological $7,000 and reinforced by 61.8% Fibo retracement level and Pivot Point one-day Support 3.
Click to see the Full Confluence Indicator
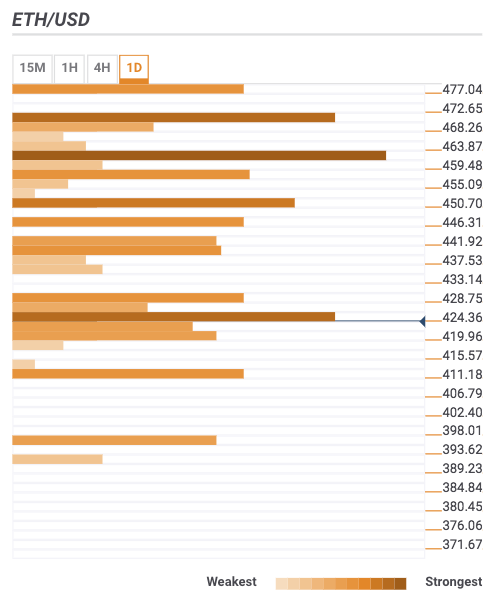
ETH/USD 1D
The second digital coin by market capitalization is changing hands $420, down 2.6% since the beginning of the day. A cluster of technical levels below the current price include:
The 4 hours low, the daily S2 Pivot Point level Support 1, the Bolinger Band 15m-Lower, the Simple Moving Average 50-15m and the last month low. If this area gives way, ETH/USD will extend the decline towards $411, where the support is created by the Pivot Point one-day Support 2, and the Pivot Point one-week Support 3.
Beyond that area, there are no noticeable support lines until $400 followed by monthly S1 Pivot Point level at $390.
The nearest resistance comes around $429 with the confluence of the one-hour Low, 40hour low, 15 min low, and a host of SMA levels. It is closely followed by daily low and weekly S2 Pivot Point level.
Another barrier is at $450 with the convergence of the Bolinger Band 4h-Middle, the Pivot Point one-week Support 1, and the PP one-day Resistance 1
Click to see the Full Confluence Indicator
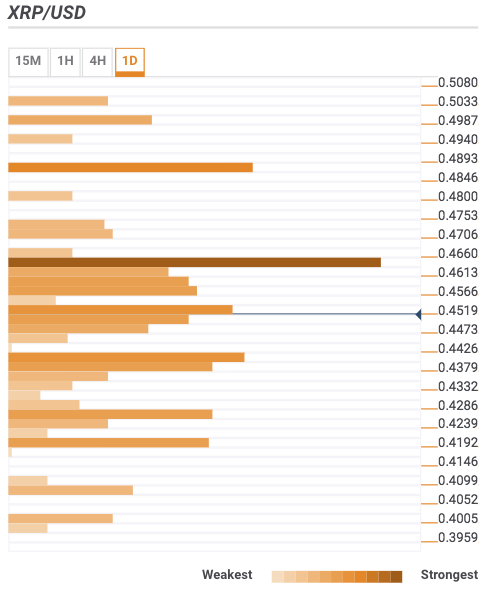
XRP 1D
Ripple is a star today, The third largest coin by market value gained 2.5% on a daily basis and touched $0.4600 handle during European hours. Currently, XRP/USD is changing hands at $0.4454.
The significant confluence of technical levels clustered around $0.4600 stopped the upside and pushed the coin back. Most likely, this area will continue to limit the recovery attempts as it is packed with essential hurdles, including the potent Fibonacci 38.2% one-month, the Fibonacci 23.6% one-week, the 4h-high, the Simple Moving Average 200-4h.
If it is cleared, the upside may be extended towards $0.4850 (Fibonacci 61.8% one-month and weekly R2 Pivot Point).
Below the current price, there are very few support lines that can stop the downside. $0.4480 confluence area created by the one-hour low and the Fibonacci 23.6% one-month. Once below, $0.4400 will come into focus. This psychological support is reinforced with Pivot Point one week Support 1, the SMA 50-15m, and the SMA 200-15m and 61.8% Fibo retracement (daily).
Click to see the Full Confluence Indicator
Author

Tanya Abrosimova
Independent Analyst


