Top 3 price prediction BTC, ETH, XRP: Quantum quicksand looking for fresh buyers from below
- Google's announcement of its quantum achievements has triggered a sell-off.
- Ethereum has emerged as a winner, as indicated by the ETH/BTC cross.
- XRP shows its bipolar personality and swaps the top for the bottom in hours.

The word of the day is quantum. Google's quantum computer was presented with results obtained in the first test that was carried out at the beginning of summer.
According to the tech giant, the test was a success, as its machine managed to complete in minutes calculations would take thousands of years to any current supercomputer.
And what does this have to do with the price of Bitcoin?
According to some qualified opinions, a machine with this computing power could decipher the complex cryptographic calculations that support the blockchain technology.
The result of the test has shaken down crypto prices, sending them to critical technical levels that have changed the active scenarios in a single day. Bitcoin, the King and flagship of the market, suffered a spectacular fall of over 8% that has put it back into the long term downward channel, and that opens a scenario where the minimum price level is at the $5,000 handle.
At the last Delta Summit on Blockchain, I had the opportunity to interview OKEx Financial Market Director Lennix Lai about the risk of quantum computers:
"Advancement in quantum computing is something that OKEx continues to keep a close eye on. We believe that new technology can move the industry forward and be used to its advantage. We will continue our mission to implement industry-leading security features that help keep consumers safe as quantum computing becomes a reality."
As I explain below, there is a silver lining to hope if the market reacts quickly to the rise, and thus avoid a " Crypto Autumn".
ETH/BTC Daily Chart
The ETH/BTC cross has benefited from the recent sell-off. After bouncing up on Wednesday in the EMA50, it retains what it won in the past and postulates as a good option for those who wish to continue accumulating Bitcoins.
Above the current price, the first resistance level is at 0.022, then the second at 0.023 and the third one at 0.025.
Below the current price, the first support level is at 0.021, then the second at 0.020 and the third one at 0.0185.
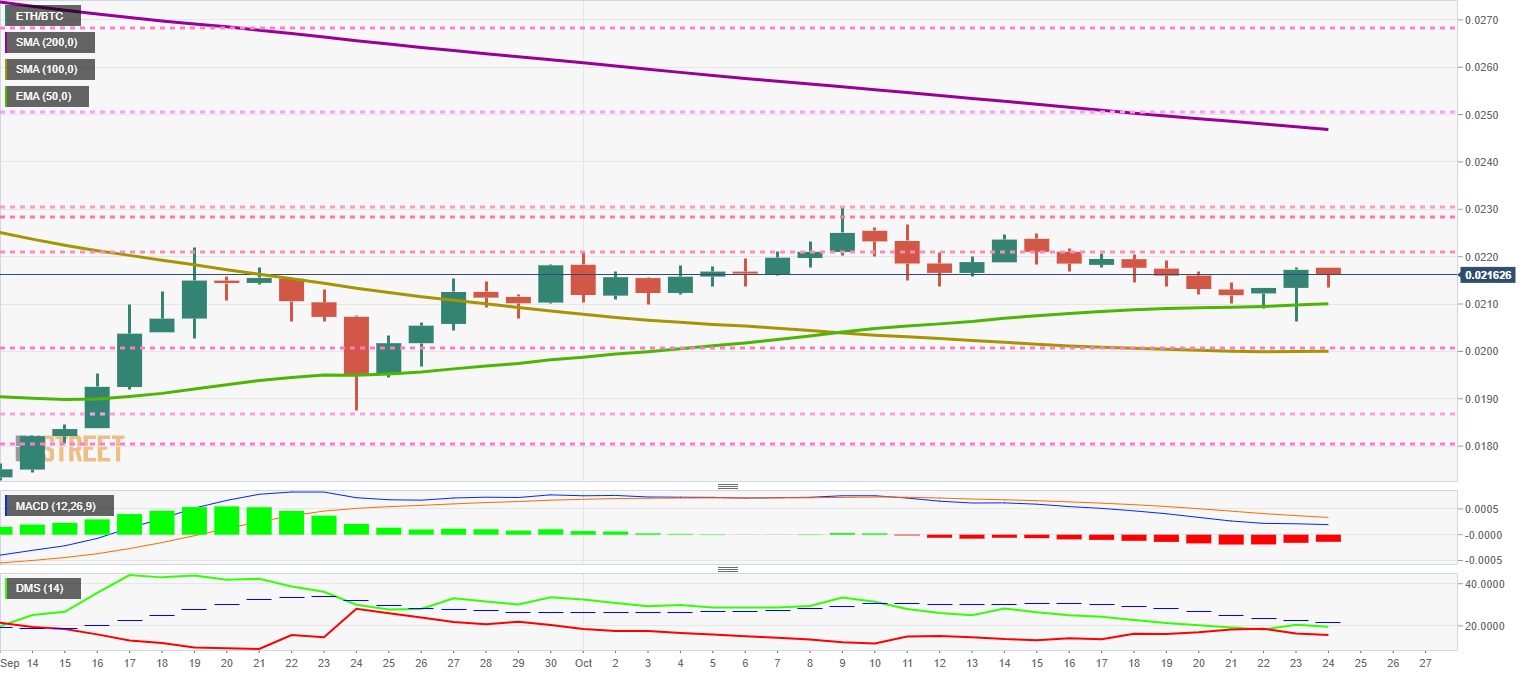
The MACD on the daily chart shows a bearish slope loss, while the distance between the lines also decreases. It is still too early to see a possible change of control towards the bulls, but ETH/BTC enjoys necessary supports, and the natural path is upwards.
The DMI in the daily chart shows how the bulls retain control with Wednesday’s rise, but without getting past the ADX line. The bears lose some strength, but they stay in the battle and could conquer leadership at any time.
BTC/USD Daily Chart
BTC/USD is currently trading at $7,469 after the Google-related sell-off. For the time being, it manages to hold onto the first level of support within the bearish channel but needs to recover the $7,700 line quickly. Otherwise, the scenario where the $5,000 level has a leading role opens up below.
Above the current price, the first resistance level is at $7,700, then the second at $7,900 and the third one at $8,000. BTC/USD targets $9,000 to switch to a bullish scenario.
Below the current price, the first support level is at $7,400, then the second at $7,100 and the third one at $6,850.
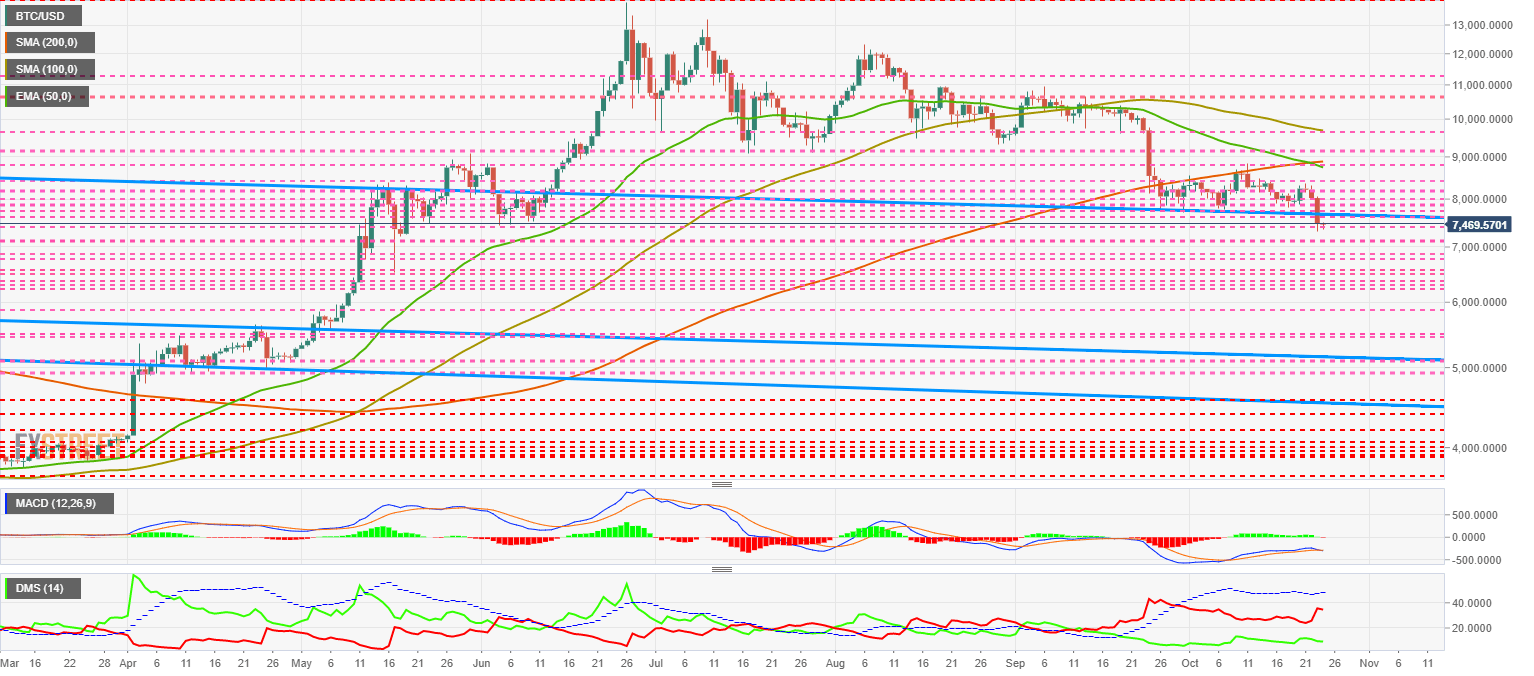
The MACD on the daily chart loses its horizontal profile and points to lower levels. A downward cut is developing between the indicator averages, but it is not yet confirmed, and there is room for a radical change.
The DMI on the daily chart shows the sharp increase in bearish strength, unaccompanied by a withdrawal of bulls of the same magnitude. It seems that the bears want to sell actively, but their offers found a robust response among the bulls.
ETH/USD Daily Chart
ETH/USD is currently trading at $161.79, recovering from Wednesday’s low of $153. As with Bitcoin, Ethereum has gone to levels not seen since May, but in this case, there is no long-term structure to make the situation worse, as is the case with Bitcoin.
Above the current price, the first resistance level is at $170, then the second at $180 and the third one at $190.
Below the current price, the first support level is at $160, then the second at $155 and the third one at $150.9.
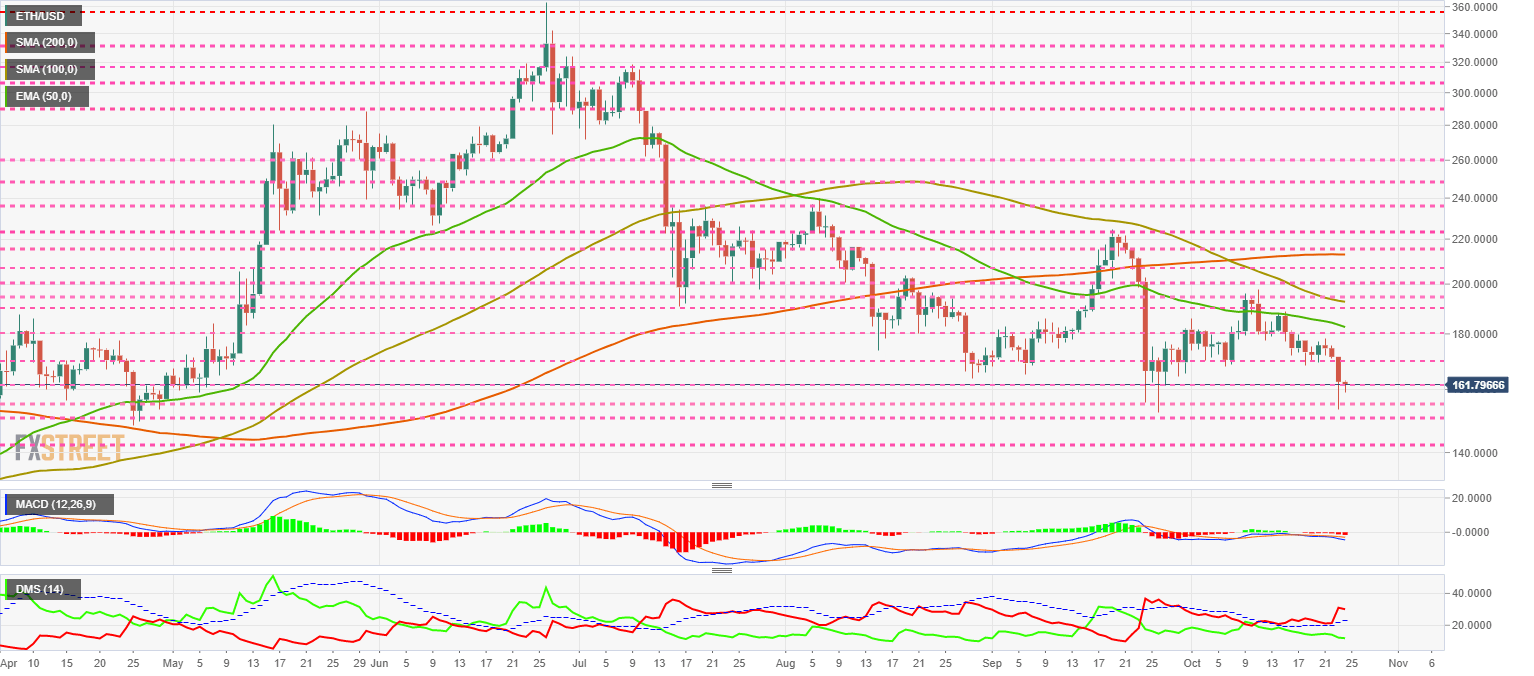
The MACD on the daily chart shows an increase in the bearish slope and, also in the opening between the lines. As with Bitcoin, this indicator can easily be turned upside down.
The DMI on the daily chart shows that bears are increasing the trend strength level as the bulls withdraw from combat. As long as sellers stay above the ADX line, a bullish turn is impossible.
XRP/USD Daily Chart
XRP/USD is currently trading at the $0.272 price level and is losing the advantage it has gained over the past few days.
It bottomed out at $0.248 on Wednesday to recover more than 8% since then.
Above the current price, the first resistance level is at $0.27, then the second at $0.275 and the third one at $0.28.
Below the current price, the first support level is at $0.265, then the second at $0.258 and the third one at $0.253.
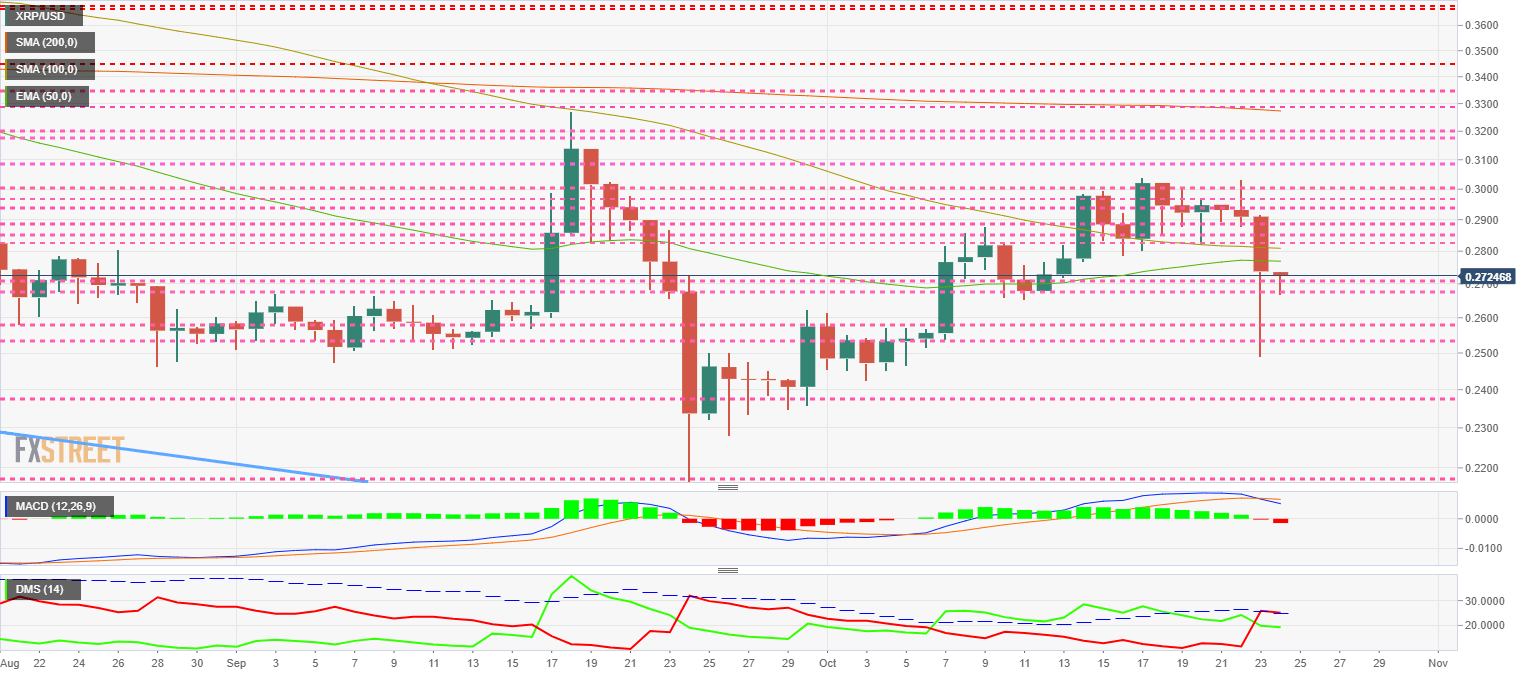
The MACD on the daily chart shows a bearish cross, with an important line opening despite the new cross. The current profile of the indicator proposes a downward scenario for the short term.
The DMI on the daily chart shows how the bears put themselves in command of the XRP/USD pair, even surpassing the ADX line, which reinforces the idea of a bearish shift in the short term. Bulls are kept at a relatively high level.
Get 24/7 Crypto updates in our social media channels: Give us a follow at @FXSCrypto and our FXStreet Crypto Trading Telegram channel
Author

Tomas Salles
FXStreet
Tomàs Sallés was born in Barcelona in 1972, he is a certified technical analyst after having completing specialized courses in Spain and Switzerland. He expanded his technical training following the guidance of great experts on the financial markets.


